QUESTION IMAGE
Question
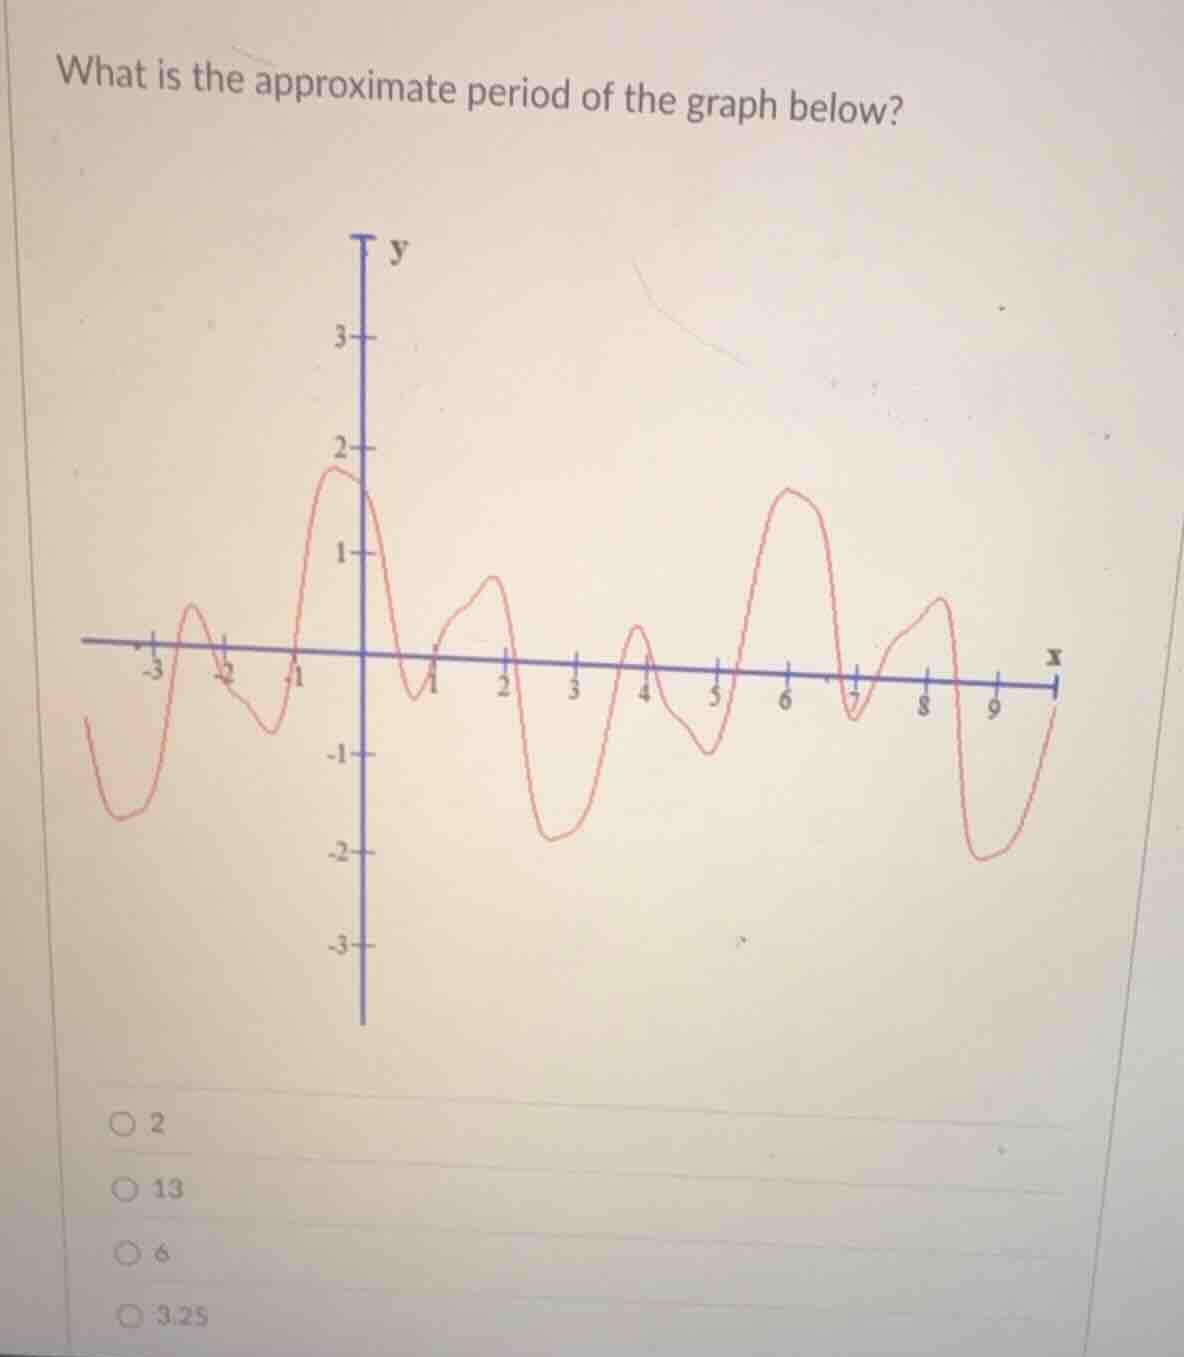
what is the approximate period of the graph below? (the graph is a coordinate system with a red curve, and the x-axis is labeled from -3 to 9, y-axis from -3 to 3. the multiple-choice options are 2, 13, 6, 3.25)
Step1: Identify a repeating peak
Take the peak near $x=0$ and the next matching peak near $x=6$.
Step2: Calculate the period
Subtract the x-values of the two peaks.
$\text{Period} = 6 - 0 = 6$

Snap & solve any problem in the app
Get step-by-step solutions on Sovi AI
Photo-based solutions with guided steps
Explore more problems and detailed explanations
6 (Option C: 6)