QUESTION IMAGE
Question
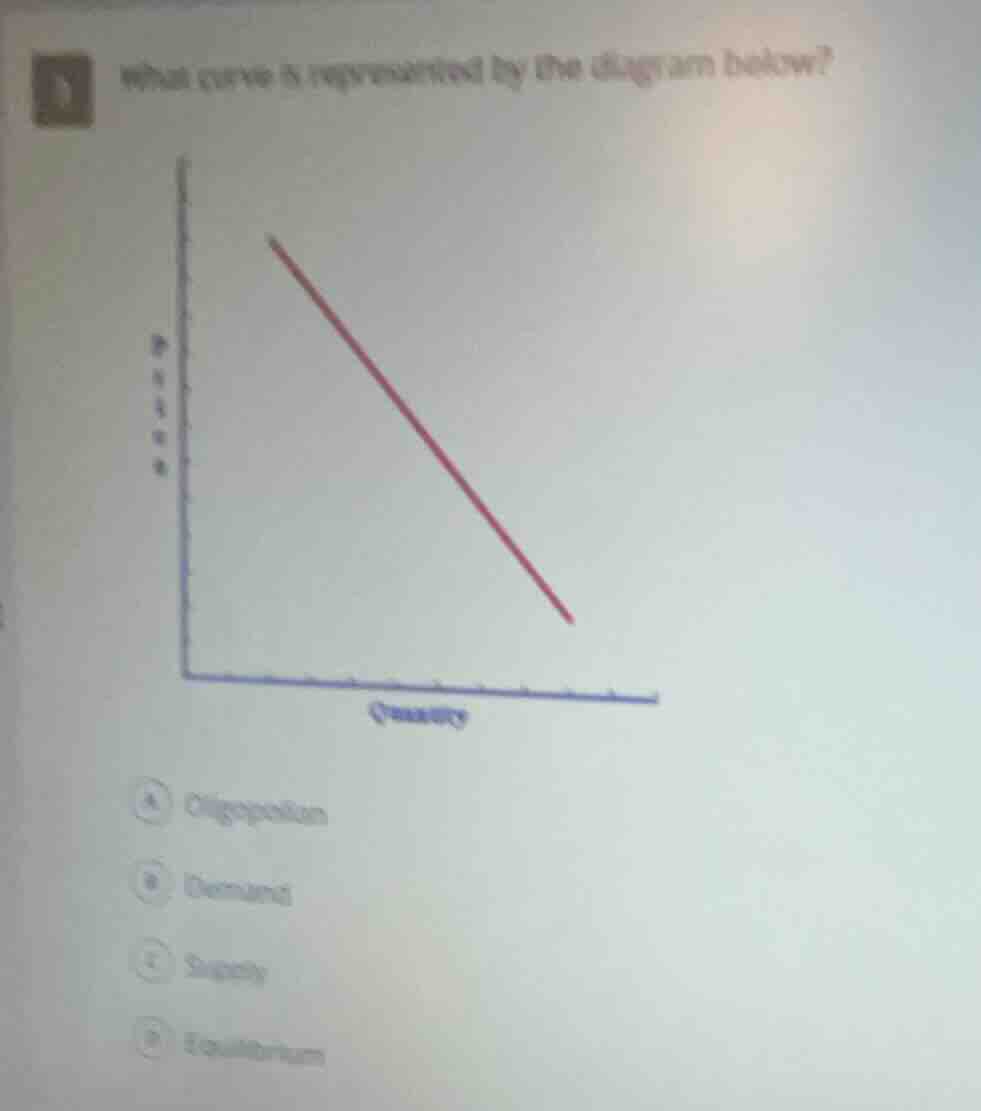
what curve is represented by the diagram below?a oligopolianb demandc supplyd equilibrium
Brief Explanations
The graph shows a downward-sloping curve with Price on the vertical axis and Quantity on the horizontal axis. This inverse relationship between price and quantity is the defining feature of a demand curve, where higher prices correspond to lower quantity demanded, and vice versa. Oligopoly refers to a market structure, not a curve; a supply curve slopes upward; equilibrium is a point (not a curve) where supply and demand intersect.

Snap & solve any problem in the app
Get step-by-step solutions on Sovi AI
Photo-based solutions with guided steps
Explore more problems and detailed explanations
B. Demand