QUESTION IMAGE
Question
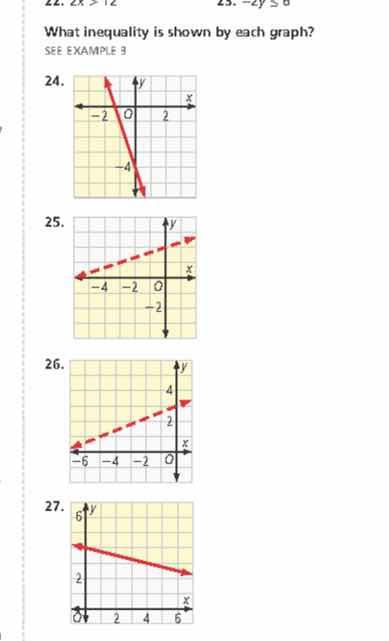
what inequality is shown by each graph?
see example 3
24.
25.
26.
27.
Step1: Find line eq for Q24
First, identify two points on the line: $(0, -3)$ and $(-2, 0)$. Slope $m=\frac{0-(-3)}{-2-0}=-\frac{3}{2}$. Using $y=mx+b$, $b=-3$, so line is $y=-\frac{3}{2}x-3$, or $3x+2y=-6$. Shading is below the solid line, so inequality is $3x+2y\leq-6$.
Step2: Find line eq for Q25
Points on line: $(0, -1)$ and $(-2, 0)$. Slope $m=\frac{0-(-1)}{-2-0}=-\frac{1}{2}$. Line: $y=-\frac{1}{2}x-1$, or $x+2y=-2$. Dotted line, shading below, so $x+2y<-2$.
Step3: Find line eq for Q26
Points on line: $(0, 3)$ and $(-6, 0)$. Slope $m=\frac{0-3}{-6-0}=\frac{1}{2}$. Line: $y=\frac{1}{2}x+3$, or $x-2y=-6$. Dotted line, shading above, so $x-2y>-6$.
Step4: Find line eq for Q27
Points on line: $(0, 5)$ and $(6, 2)$. Slope $m=\frac{2-5}{6-0}=-\frac{1}{2}$. Line: $y=-\frac{1}{2}x+5$, or $x+2y=10$. Solid line, shading below, so $x+2y\leq10$.

Snap & solve any problem in the app
Get step-by-step solutions on Sovi AI
Photo-based solutions with guided steps
Explore more problems and detailed explanations
- $3x + 2y \leq -6$
- $x + 2y < -2$
- $x - 2y > -6$
- $x + 2y \leq 10$