QUESTION IMAGE
Question
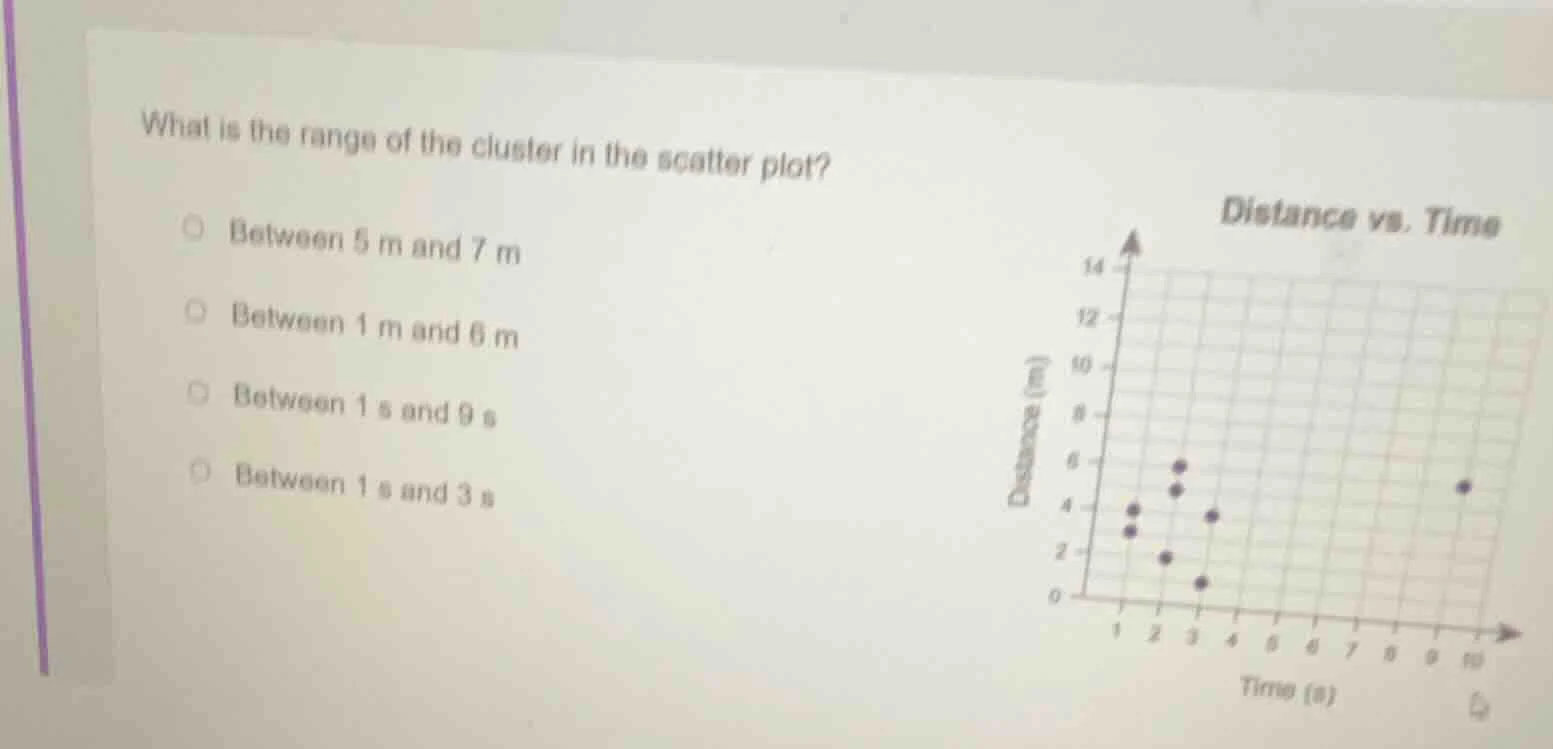
what is the range of the cluster in the scatter plot?
between 5 m and 7 m
between 1 m and 6 m
between 1 s and 9 s
between 1 s and 3 s
distance vs. time
scatter plot with distance (m) on y - axis from 0 to 14 and time (s) on x - axis from 1 to 10, with data points
First, identify the cluster of points in the scatter plot: these are the grouped points at time values from 1 second to 3 seconds. The range of the cluster refers to the spread of the relevant axis for the clustered data; since the outlier is at 10s, the cluster's range is the interval of time where most points are concentrated.

Snap & solve any problem in the app
Get step-by-step solutions on Sovi AI
Photo-based solutions with guided steps
Explore more problems and detailed explanations
D. Between 1 s and 3 s