QUESTION IMAGE
Question
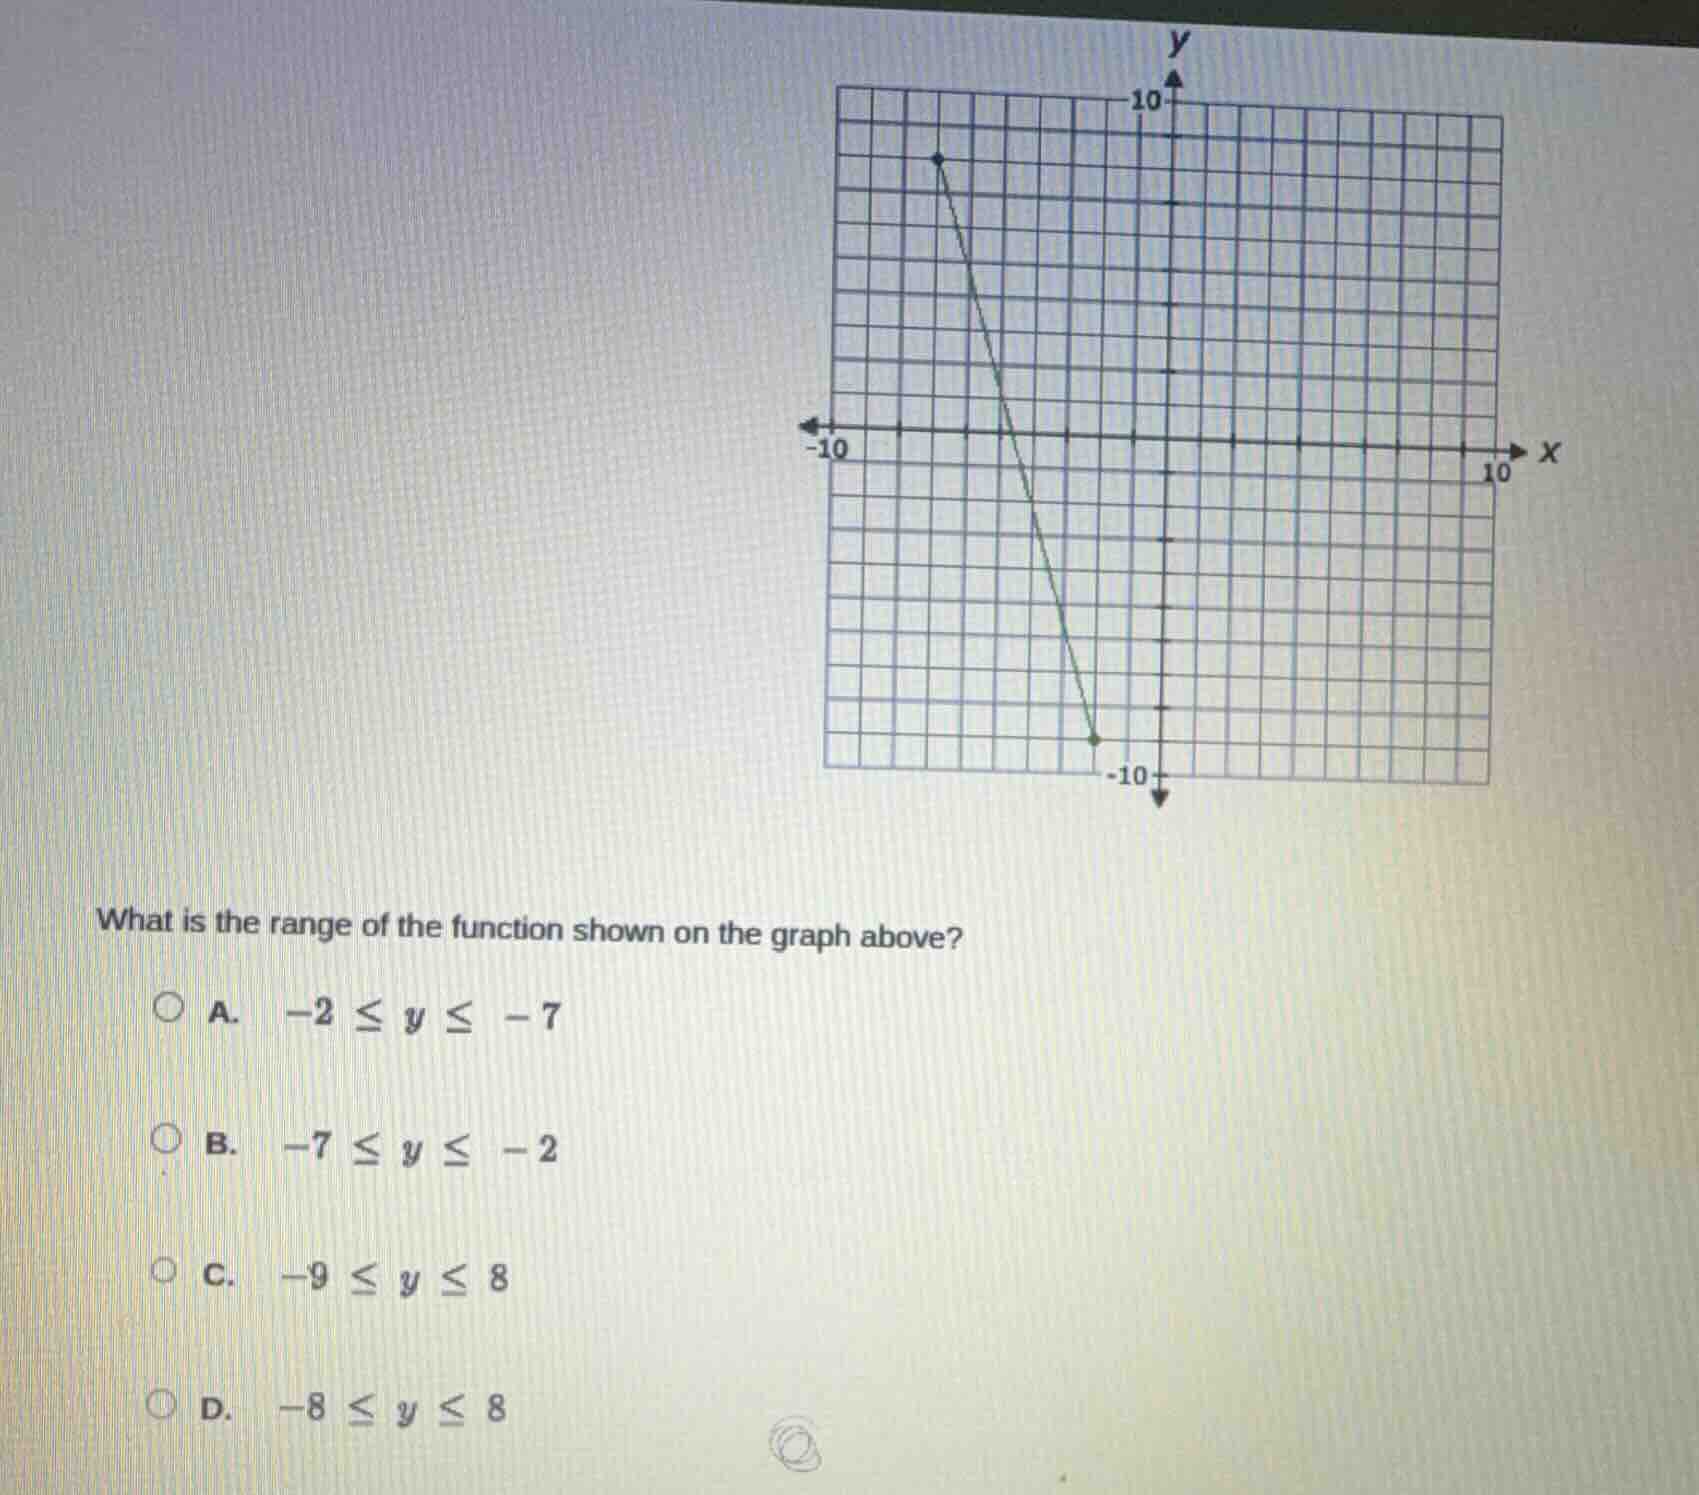
what is the range of the function shown on the graph above?
a. $-2 \leq y \leq -7$
b. $-7 \leq y \leq -2$
c. $-9 \leq y \leq 8$
d. $-8 \leq y \leq 8$
Step1: Identify the highest and lowest y - values
The range of a function is the set of all possible y - values (outputs) of the function. From the graph, we can see the highest point (maximum y - value) and the lowest point (minimum y - value). The top point has a y - value of 8 (by looking at the grid, we can count the units) and the bottom point has a y - value of - 9 (similarly, by counting the units on the y - axis). So the range should be from the minimum y - value to the maximum y - value, which is \(-9\leq y\leq8\).
Step2: Eliminate other options
- Option A: \(-2\leq y\leq - 7\) has positive lower bound and negative upper bound, which is incorrect as the minimum y - value is - 9 and maximum is 8.
- Option B: \(-7\leq y\leq - 2\) also has incorrect bounds as it does not include the actual minimum and maximum y - values from the graph.
- Option D: \(-8\leq y\leq8\) has an incorrect lower bound (the actual minimum y - value is - 9, not - 8).

Snap & solve any problem in the app
Get step-by-step solutions on Sovi AI
Photo-based solutions with guided steps
Explore more problems and detailed explanations
C. \(-9\leq y\leq8\)