QUESTION IMAGE
Question
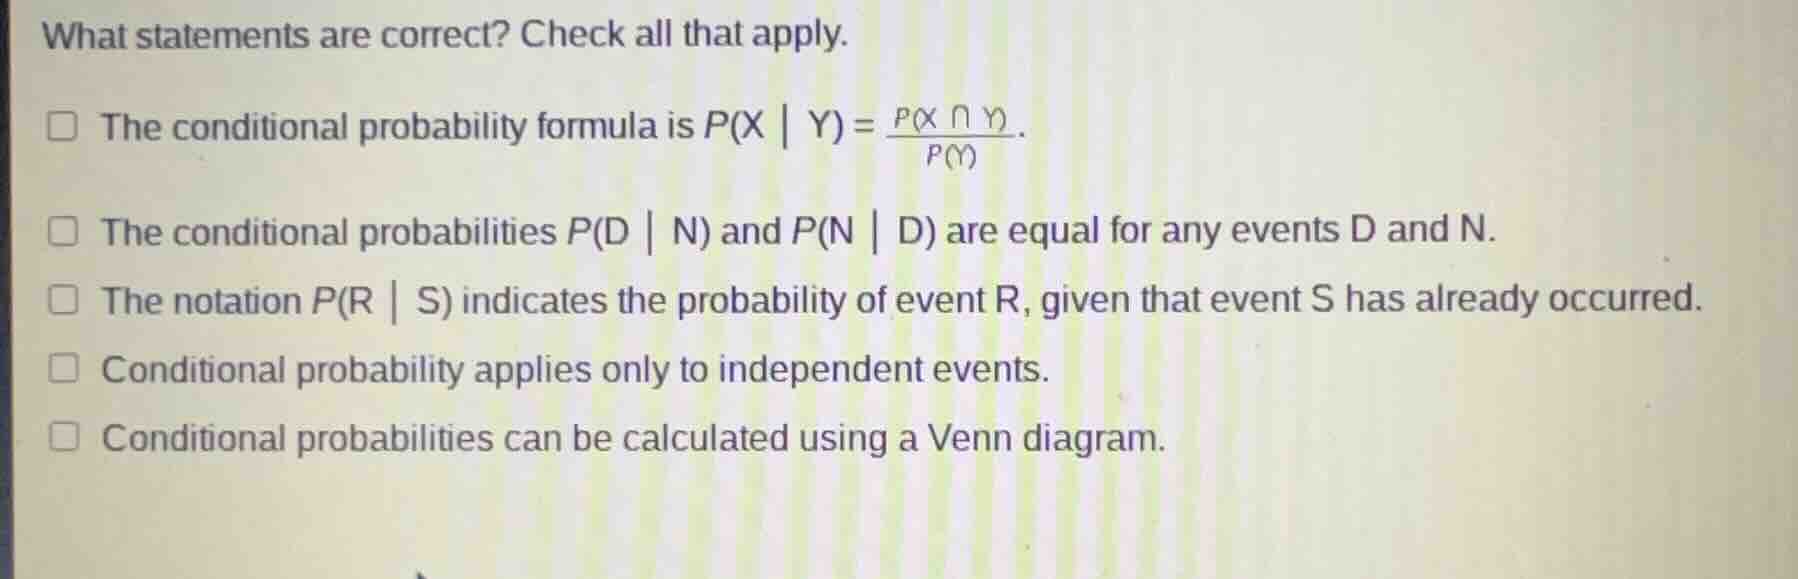
what statements are correct? check all that apply. the conditional probability formula is $p(x \mid y)=\frac{p(x \cap y)}{p(y)}$. the conditional probabilities $p(d \mid n)$ and $p(n \mid d)$ are equal for any events d and n. the notation $p(r \mid s)$ indicates the probability of event r, given that event s has already occurred. conditional probability applies only to independent events. conditional probabilities can be calculated using a venn diagram.
Brief Explanations
- For the first statement: The formula for conditional probability is indeed \( P(X \mid Y) = \frac{P(X \cap Y)}{P(Y)} \) (when \( P(Y)
eq 0 \)), so this is correct.
- For the second statement: \( P(D \mid N)=\frac{P(D\cap N)}{P(N)} \) and \( P(N \mid D)=\frac{P(D\cap N)}{P(D)} \). These are equal only if \( P(N) = P(D) \), not for any events \( D \) and \( N \), so this is incorrect.
- For the third statement: The notation \( P(R \mid S) \) is defined as the probability of event \( R \) occurring given that event \( S \) has already occurred, so this is correct.
- For the fourth statement: Conditional probability applies to dependent events as well (in fact, it's often used to analyze dependent events). Independent events have \( P(X \mid Y)=P(X) \), but conditional probability is not restricted to independent events, so this is incorrect.
- For the fifth statement: A Venn diagram can help visualize the sample space and the intersections of events, which can be used to calculate conditional probabilities (by finding the ratio of the favorable region to the given event's region), so this is correct.

Snap & solve any problem in the app
Get step-by-step solutions on Sovi AI
Photo-based solutions with guided steps
Explore more problems and detailed explanations
- The conditional probability formula is \( P(X \mid Y) = \frac{P(X \cap Y)}{P(Y)} \).
- The notation \( P(R \mid S) \) indicates the probability of event \( R \), given that event \( S \) has already occurred.
- Conditional probabilities can be calculated using a Venn diagram.