QUESTION IMAGE
Question
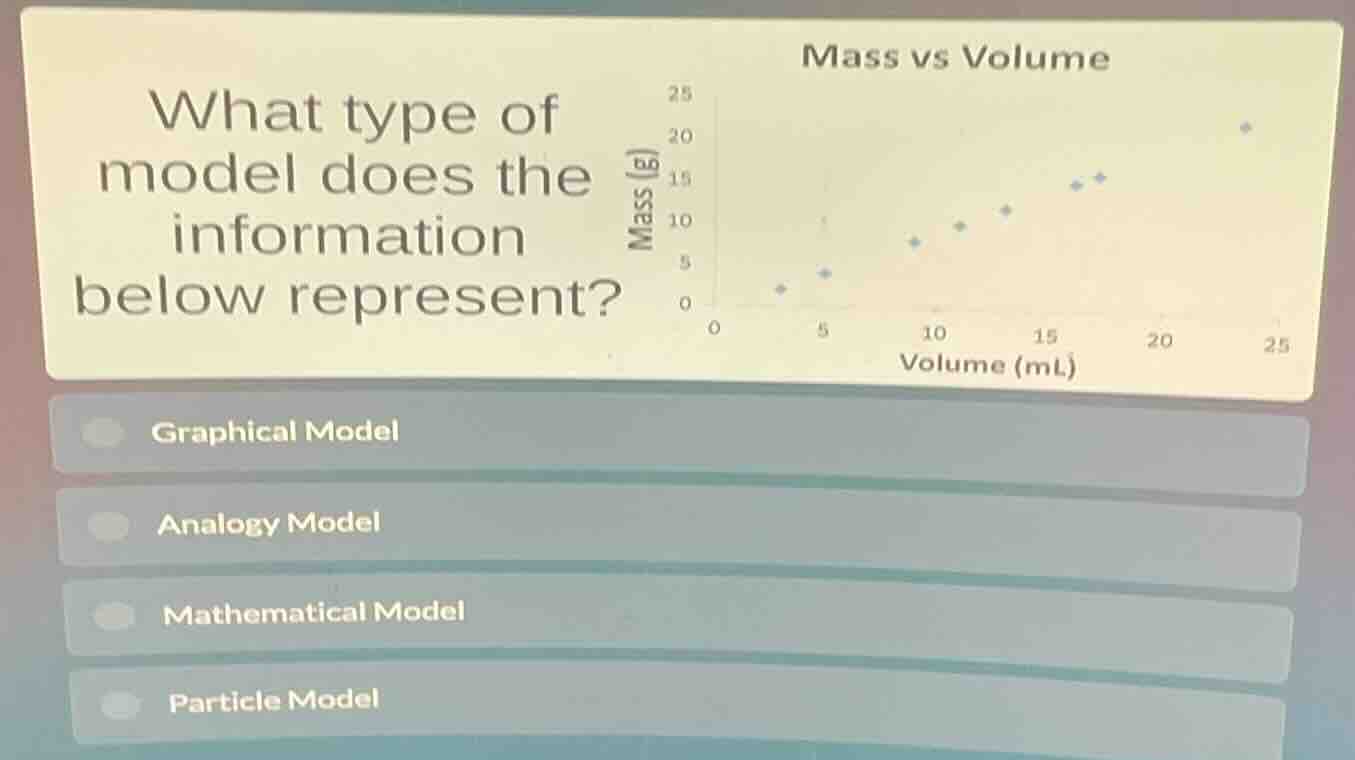
what type of model does the information below represent?
mass vs volume
chart: mass (g) on y - axis, volume (ml) on x - axis, with data points plotted
options:
graphical model
analogy model
mathematical model
particle model
A graphical model represents data visually, often using graphs (like scatter plots here) to show relationships between variables (mass and volume). The provided image is a scatter plot of mass vs volume, so it's a graphical model. Analogy models use comparisons, mathematical models use equations, and particle models relate to matter's structure—none fit here.

Snap & solve any problem in the app
Get step-by-step solutions on Sovi AI
Photo-based solutions with guided steps
Explore more problems and detailed explanations
A. Graphical Model