QUESTION IMAGE
Question
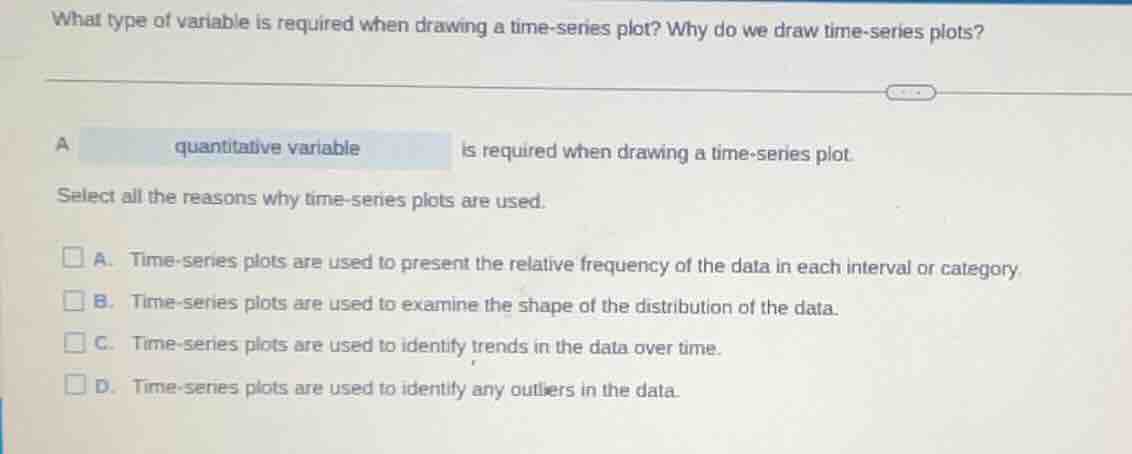
what type of variable is required when drawing a time - series plot? why do we draw time - series plots?
a quantitative variable is required when drawing a time - series plot.
select all the reasons why time - series plots are used.
□ a. time - series plots are used to present the relative frequency of the data in each interval or category.
□ b. time - series plots are used to examine the shape of the distribution of the data.
□ c. time - series plots are used to identify trends in the data over time.
□ d. time - series plots are used to identify any outliers in the data.
- For the first part, a time - series plot shows the change of a variable over time, and this variable needs to be a quantitative variable (e.g., stock prices, temperature over time) as we need numerical values to plot the changes over time.
- For the multiple - choice part:
- Option A: Presenting relative frequency of data in each interval or category is the job of a histogram or bar graph, not a time - series plot.
- Option B: Examining the shape of the distribution of data is done by a histogram or a stem - and - leaf plot, not a time - series plot.
- Option C: Time - series plots are specifically designed to show how a variable changes over time, so we can identify trends (upward, downward, or stationary) in the data over time.
- Option D: Since time - series plots show the data points over time, we can easily spot any data points that are far from the general pattern, i.e., outliers.

Snap & solve any problem in the app
Get step-by-step solutions on Sovi AI
Photo-based solutions with guided steps
Explore more problems and detailed explanations
A quantitative variable is required when drawing a time - series plot.
The correct options for the reasons why time - series plots are used are:
C. Time - series plots are used to identify trends in the data over time.
D. Time - series plots are used to identify any outliers in the data.