QUESTION IMAGE
Question
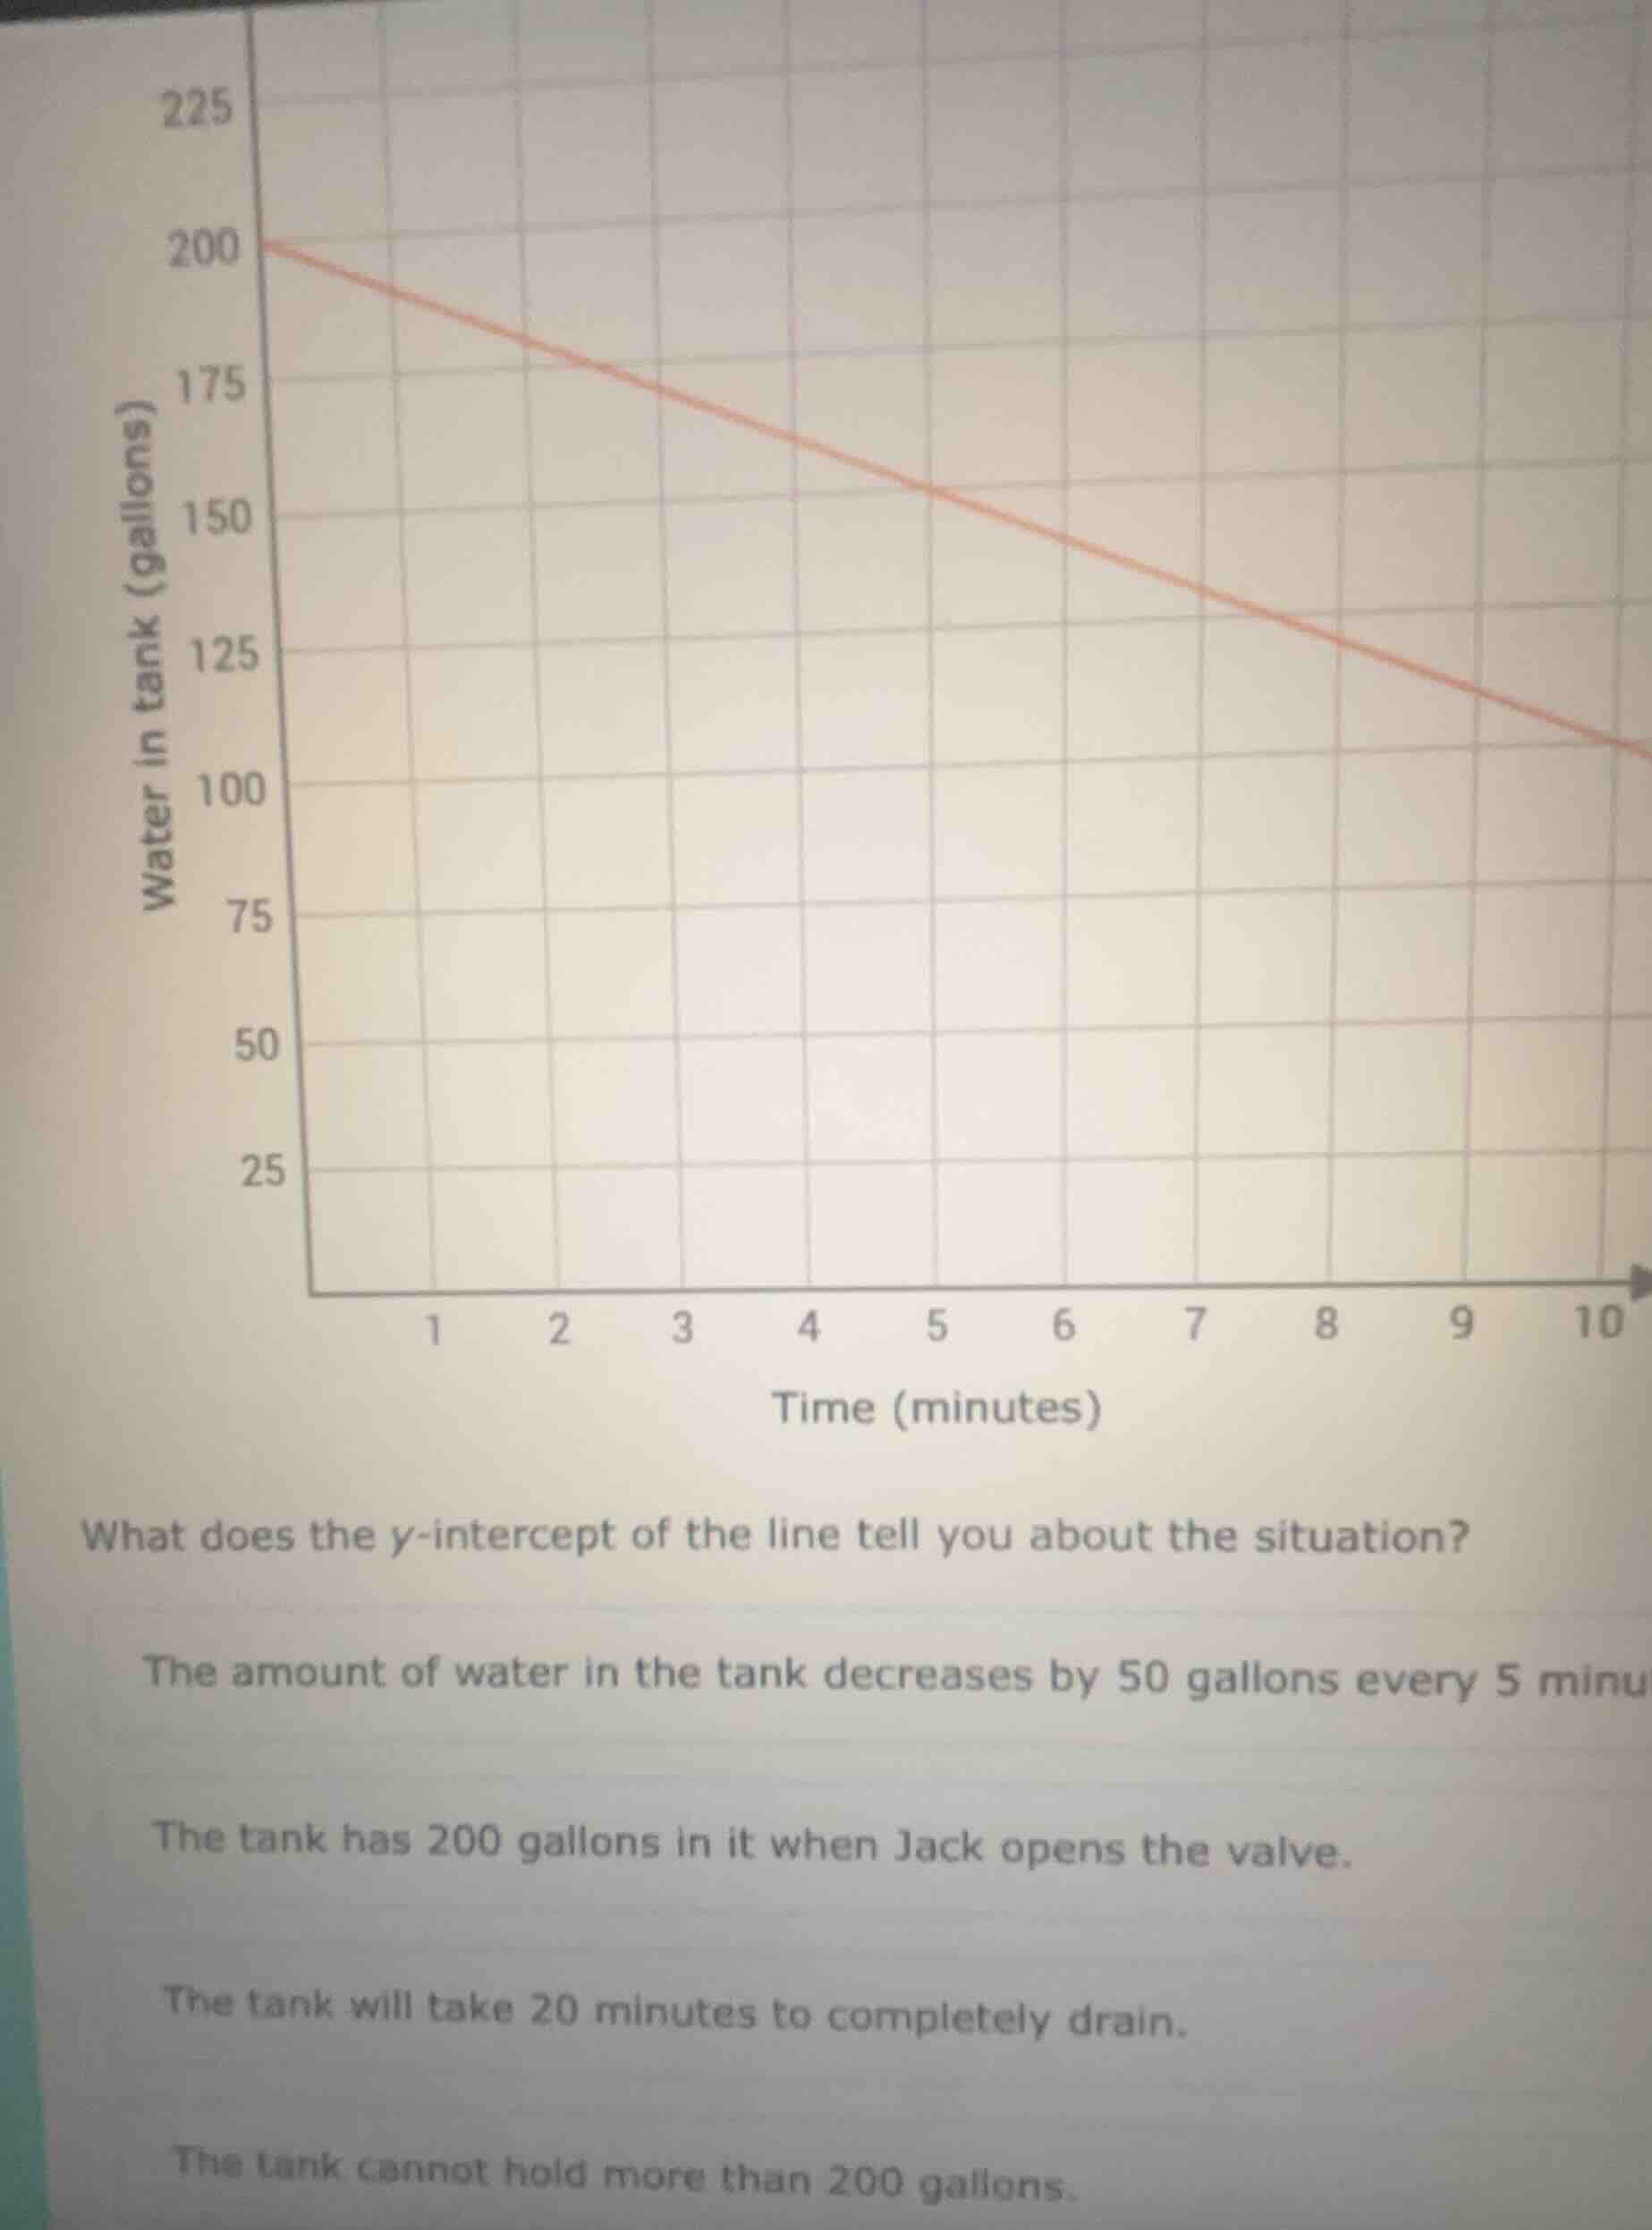
what does the y-intercept of the line tell you about the situation? the amount of water in the tank decreases by 50 gallons every 5 minu the tank has 200 gallons in it when jack opens the valve. the tank will take 20 minutes to completely drain. the tank cannot hold more than 200 gallons.
The y - intercept of a linear graph is the value of the dependent variable (here, water in the tank) when the independent variable (time) is 0. From the graph, at time \( t = 0 \) minutes (when Jack opens the valve, presumably), the water in the tank is 200 gallons. The first option describes the rate of change (slope - related), the third option is about the time to drain (related to the x - intercept or solving for when \( y=0 \)), and the fourth option is about the tank's capacity which is not indicated by the y - intercept.

Snap & solve any problem in the app
Get step-by-step solutions on Sovi AI
Photo-based solutions with guided steps
Explore more problems and detailed explanations
The tank has 200 gallons in it when Jack opens the valve.