QUESTION IMAGE
Question
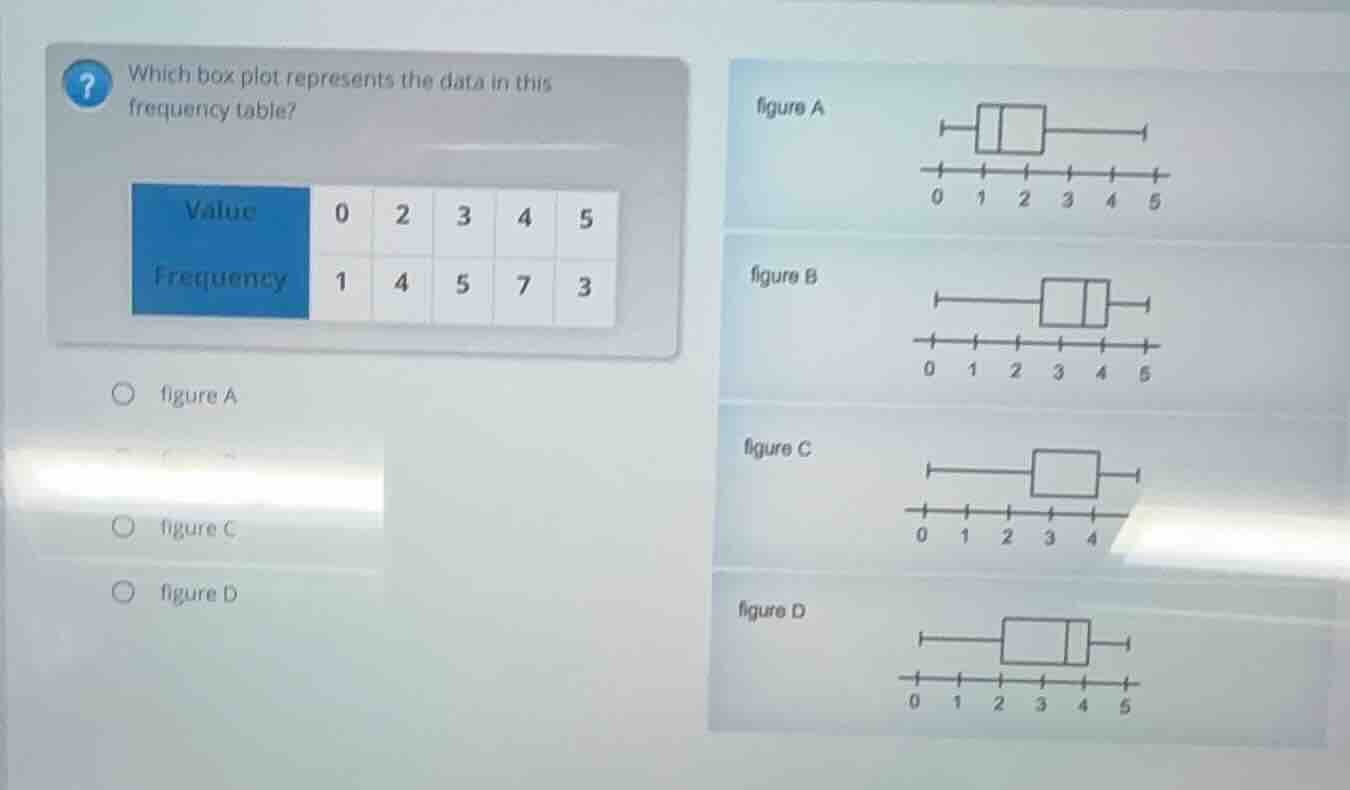
which box plot represents the data in this frequency table?
value: 0, 2, 3, 4, 5
frequency: 1, 4, 5, 7, 3
options: figure a, figure c, figure d
(with box plot figures a, b, c, d as described)
Step1: Calculate total data points
Sum all frequencies: $1 + 4 + 5 + 7 + 3 = 20$
Step2: Identify min and max values
Minimum value = $0$, Maximum value = $5$
Step3: Find median (2nd quartile, Q2)
Total data points = 20, median is average of 10th and 11th values.
Ordered data cumulative counts: 0(1), 2(5), 3(10), 4(17), 5(20).
10th value = 3, 11th value = 4. Median: $\frac{3+4}{2} = 3.5$
Step4: Find 1st quartile (Q1)
Q1 is median of first 10 values. 5th and 6th values are 2 and 3. Q1: $\frac{2+3}{2} = 2.5$
Step5: Find 3rd quartile (Q3)
Q3 is median of last 10 values. 15th and 16th values are 4 and 4. Q3: $\frac{4+4}{2} = 4$
Step6: Match to box plot
Box plot has min=0, Q1=2.5, Q2=3.5, Q3=4, max=5. This matches Figure B.

Snap & solve any problem in the app
Get step-by-step solutions on Sovi AI
Photo-based solutions with guided steps
Explore more problems and detailed explanations
figure B