QUESTION IMAGE
Question
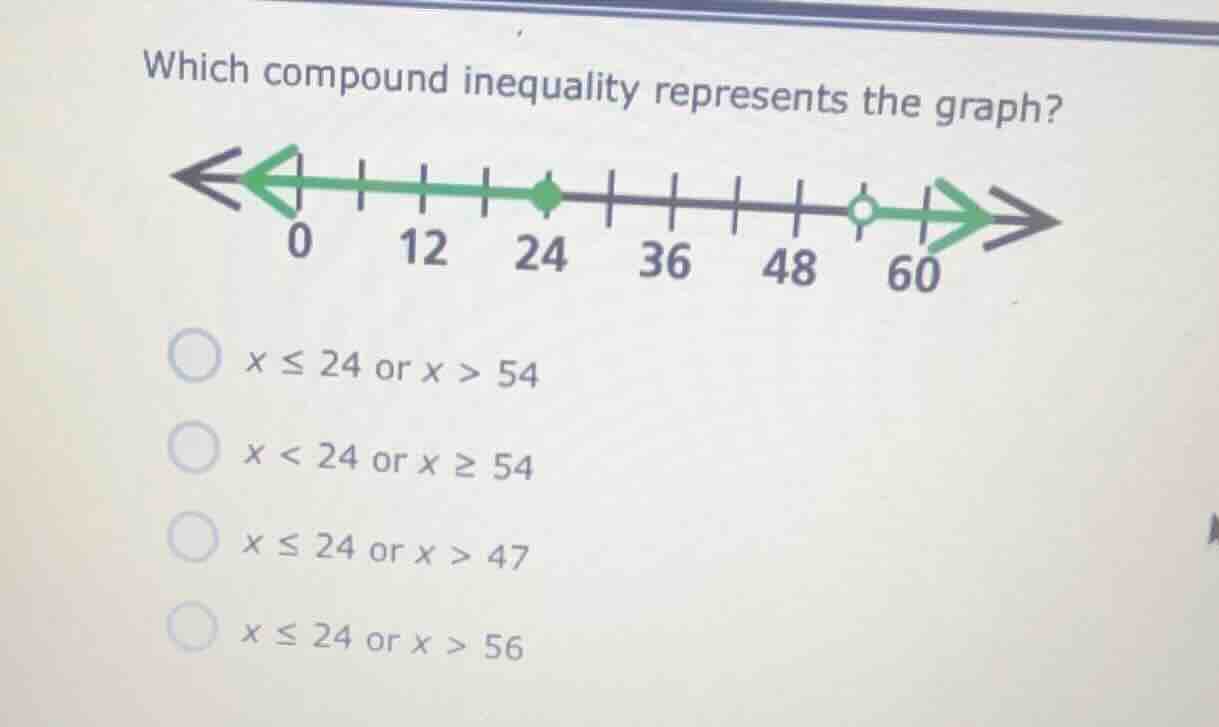
which compound inequality represents the graph?
$x \leq 24$ or $x > 54$
$x < 24$ or $x \geq 54$
$x \leq 24$ or $x > 47$
$x \leq 24$ or $x > 56$
Step1: Analyze left graph segment
The closed dot at 24 means $x \leq 24$, and the arrow points left.
Step2: Analyze right graph segment
The open dot is halfway between 48 and 60, so it is 54. The arrow points right, meaning $x > 54$.
Step3: Combine the inequalities
The graph represents the union of the two segments.

Snap & solve any problem in the app
Get step-by-step solutions on Sovi AI
Photo-based solutions with guided steps
Explore more problems and detailed explanations
A. $x \leq 24$ or $x > 54$