QUESTION IMAGE
Question
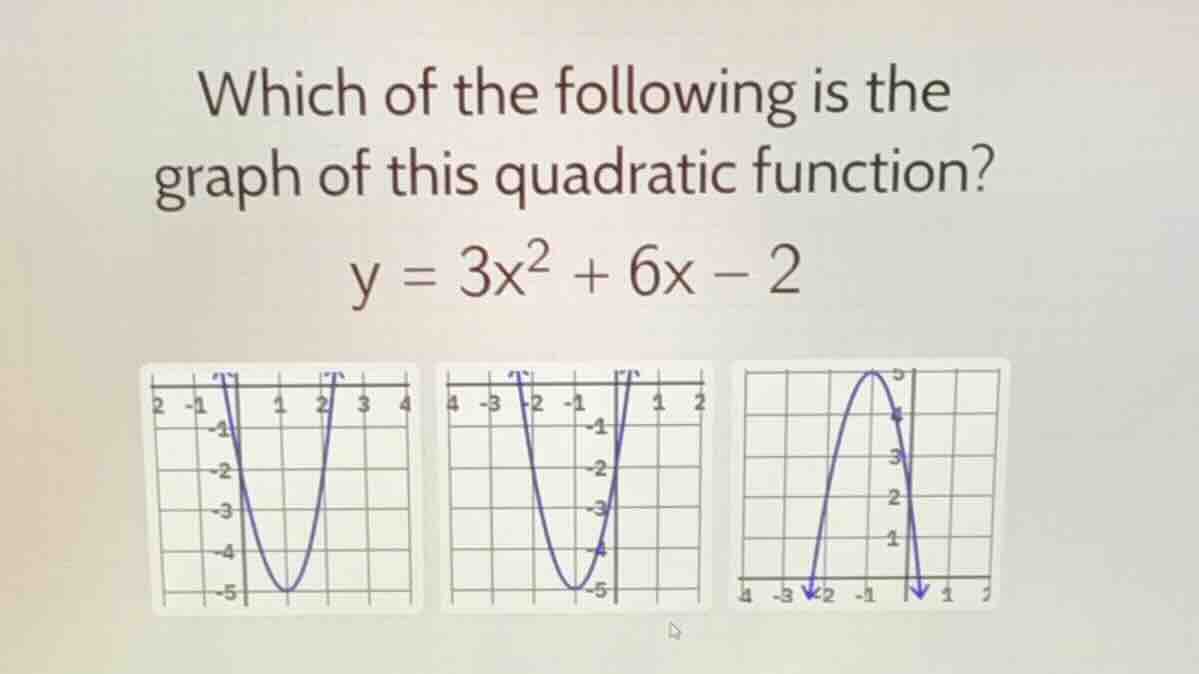
which of the following is the graph of this quadratic function?
y = 3x² + 6x - 2
Step1: Determine the direction of the parabola
The coefficient of \(x^2\) in the quadratic function \(y = 3x^2+6x - 2\) is \(a = 3\). Since \(a>0\), the parabola opens upwards. So we can eliminate the third graph (which opens downwards).
Step2: Find the vertex of the parabola
The x - coordinate of the vertex of a quadratic function \(y=ax^2 + bx + c\) is given by \(x=-\frac{b}{2a}\). For \(y = 3x^2+6x - 2\), \(a = 3\) and \(b = 6\). Then \(x=-\frac{6}{2\times3}=- 1\).
To find the y - coordinate of the vertex, substitute \(x=-1\) into the function:
\(y=3\times(-1)^2+6\times(-1)-2=3 - 6 - 2=-5\). So the vertex is at \((-1,-5)\).
Step3: Analyze the y - intercept
The y - intercept of a quadratic function \(y = ax^2+bx + c\) is found by setting \(x = 0\). For \(y=3x^2 + 6x-2\), when \(x = 0\), \(y=-2\).
Now let's analyze the first two graphs:
- For the first graph: The vertex seems to be at a point with \(y\) - coordinate around \(- 5\) and \(x=-1\)? Wait, no, let's check the x - intercepts or the position. Wait, when \(x = 0\), \(y=-2\). Let's check the second graph: when \(x = 0\), the y - value is \(-2\)? Wait, no, let's re - evaluate.
Wait, the first graph: let's check the x - intercepts. The quadratic formula for \(ax^2+bx + c = 0\) is \(x=\frac{-b\pm\sqrt{b^2 - 4ac}}{2a}\). For \(y = 3x^2+6x - 2\), \(b^2-4ac=36-4\times3\times(-2)=36 + 24 = 60\). \(x=\frac{-6\pm\sqrt{60}}{6}=\frac{-6\pm2\sqrt{15}}{6}=\frac{-3\pm\sqrt{15}}{3}=-1\pm\frac{\sqrt{15}}{3}\). \(\sqrt{15}\approx3.87\), so \(\frac{\sqrt{15}}{3}\approx1.29\). So the roots are \(x=-1 + 1.29\approx0.29\) and \(x=-1-1.29\approx - 2.29\).
Now, the second graph: the x - intercepts are around \(x=-2\) and \(x = 0.3\) (approx). The first graph has x - intercepts around \(x=-0.3\) and \(x = 2.3\) (approx). Wait, no, let's go back to the vertex and y - intercept.
The vertex is at \((-1,-5)\), the parabola opens upwards, and the y - intercept is \(y=-2\). Let's check the second graph: the vertex is at \((-1,-5)\), and when \(x = 0\), \(y=-2\) (matches the y - intercept). The first graph: when \(x = 0\), the y - value is \(-2\)? Wait, no, the first graph at \(x = 0\) seems to have \(y=-3\) or something else. Wait, maybe I made a mistake. Wait, let's re - calculate the y - intercept. When \(x = 0\), \(y=3(0)^2+6(0)-2=-2\).
Looking at the second graph: at \(x = 0\), the y - coordinate is \(-2\), the vertex is at \((-1,-5)\), and the parabola opens upwards. The first graph: the vertex is not at \((-1,-5)\) (the y - coordinate of the vertex in the first graph seems to be higher than \(-5\)). So the second graph (the middle one) has the correct vertex \((-1,-5)\), opens upwards, and has a y - intercept of \(-2\) (when \(x = 0\), \(y=-2\)). Wait, no, when \(x = 0\), in the second graph, the point is at \(y=-2\)? Wait, maybe my initial analysis of the first graph was wrong. Wait, let's re - check the vertex.
Wait, the formula for the vertex is correct. \(x =-\frac{b}{2a}=-\frac{6}{6}=-1\), \(y=3(-1)^2 + 6(-1)-2=3 - 6 - 2=-5\). So the vertex is \((-1,-5)\). Now, let's look at the first graph: the lowest point (vertex) seems to be at \(x = 1\)? No, that's not right. The second graph: the vertex is at \(x=-1\) and \(y=-5\), which matches our calculation. Also, the y - intercept when \(x = 0\) is \(y=-2\), which is consistent with the second graph. The first graph: when \(x = 0\), the y - value is \(-3\) (from the graph), which does not match \(y=-2\). So the correct graph is the second one (the middle graph).

Snap & solve any problem in the app
Get step-by-step solutions on Sovi AI
Photo-based solutions with guided steps
Explore more problems and detailed explanations
The middle graph (the second graph among the three given graphs) is the graph of the quadratic function \(y = 3x^2+6x - 2\)