QUESTION IMAGE
Question
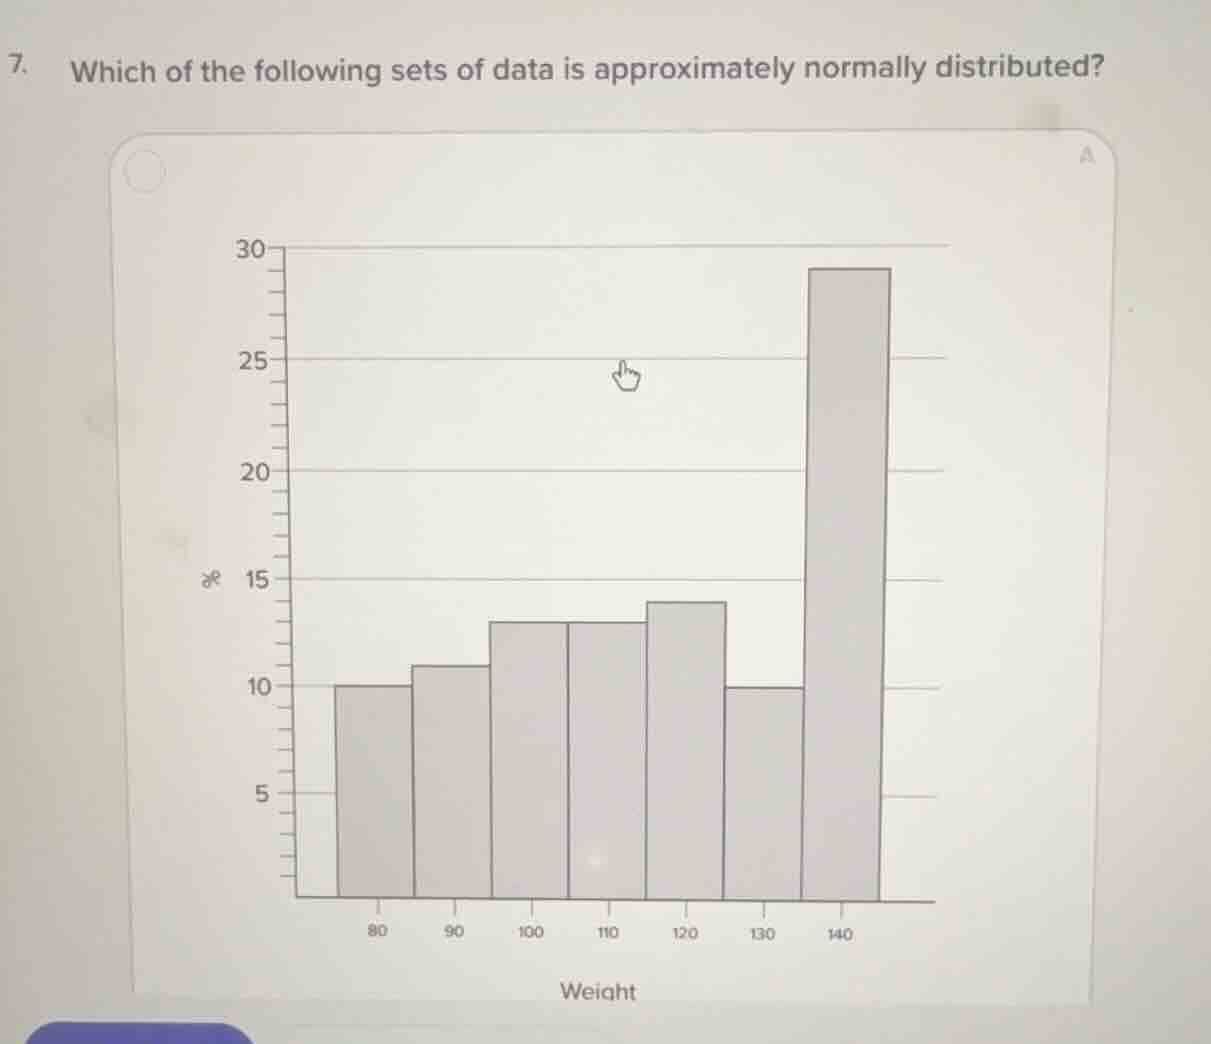
- which of the following sets of data is approximately normally distributed?
To determine which data set is approximately normally distributed, we recall the properties of a normal distribution: it is symmetric, bell - shaped, with most data around the mean and tapering off on both sides.
Analyzing the given histogram:
- Symmetry check: The given histogram has a very tall bar on the right - hand side (around 140 weight) and the bars on the left do not mirror the bars on the right in a symmetric way. A normal distribution should be symmetric about the mean. So, this histogram does not represent a normal distribution. But since the question is about which set is approximately normal (and we assume there are other histograms not shown here, but based on the property of normal distribution), a data set with a symmetric, bell - shaped histogram (where the frequencies increase to a peak and then decrease in a symmetric manner) is normally distributed.
However, since the user has only provided one histogram (which is not normal) and the question is about identifying the normally distributed set, we assume that among the options (not fully shown here), the one with a symmetric, bell - shaped frequency distribution (histogram) is the answer.
If we consider the ideal normal distribution shape: a histogram where the bars are symmetric around a central value, with the height of the bars increasing to a peak and then decreasing in a mirror - image way on either side of the peak.
Since the question is a multiple - choice (implied by the option 'A' and the nature of the question) and we need to identify the normally distributed set, the set with a symmetric, bell - shaped histogram (not the one shown here as it is skewed right) is the answer. But as the full set of options is not provided, if we assume that there is an option with a symmetric, bell - shaped distribution (for example, if there was a histogram with bars that are symmetric around a central mean, increasing to a peak and then decreasing symmetrically), that would be the normally distributed set.
But since the user's question is likely expecting the identification based on the normal distribution property, and if we assume that the correct option (not shown here in full) has a symmetric, bell - shaped histogram, the answer would be the option with such a histogram.
(Note: Since the full set of options is not provided, but based on the normal distribution property, the answer is the data set with a symmetric, bell - shaped frequency distribution.)

Snap & solve any problem in the app
Get step-by-step solutions on Sovi AI
Photo-based solutions with guided steps
Explore more problems and detailed explanations
To determine which data set is approximately normally distributed, we recall the properties of a normal distribution: it is symmetric, bell - shaped, with most data around the mean and tapering off on both sides.
Analyzing the given histogram:
- Symmetry check: The given histogram has a very tall bar on the right - hand side (around 140 weight) and the bars on the left do not mirror the bars on the right in a symmetric way. A normal distribution should be symmetric about the mean. So, this histogram does not represent a normal distribution. But since the question is about which set is approximately normal (and we assume there are other histograms not shown here, but based on the property of normal distribution), a data set with a symmetric, bell - shaped histogram (where the frequencies increase to a peak and then decrease in a symmetric manner) is normally distributed.
However, since the user has only provided one histogram (which is not normal) and the question is about identifying the normally distributed set, we assume that among the options (not fully shown here), the one with a symmetric, bell - shaped frequency distribution (histogram) is the answer.
If we consider the ideal normal distribution shape: a histogram where the bars are symmetric around a central value, with the height of the bars increasing to a peak and then decreasing in a mirror - image way on either side of the peak.
Since the question is a multiple - choice (implied by the option 'A' and the nature of the question) and we need to identify the normally distributed set, the set with a symmetric, bell - shaped histogram (not the one shown here as it is skewed right) is the answer. But as the full set of options is not provided, if we assume that there is an option with a symmetric, bell - shaped distribution (for example, if there was a histogram with bars that are symmetric around a central mean, increasing to a peak and then decreasing symmetrically), that would be the normally distributed set.
But since the user's question is likely expecting the identification based on the normal distribution property, and if we assume that the correct option (not shown here in full) has a symmetric, bell - shaped histogram, the answer would be the option with such a histogram.
(Note: Since the full set of options is not provided, but based on the normal distribution property, the answer is the data set with a symmetric, bell - shaped frequency distribution.)