QUESTION IMAGE
Question
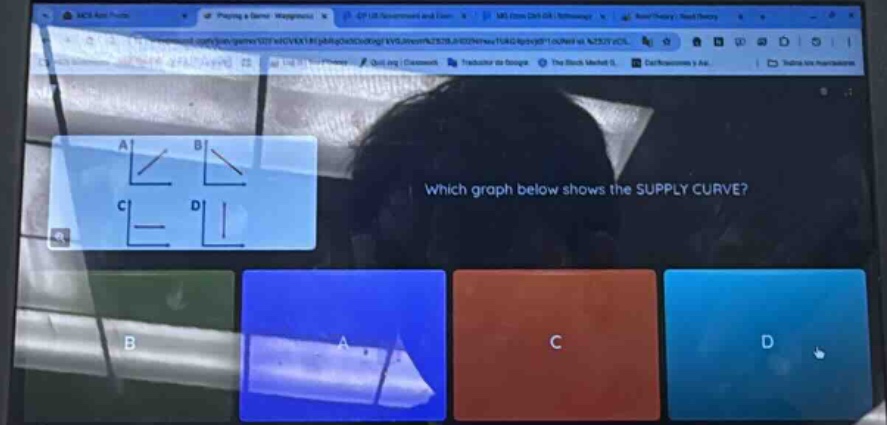
which graph below shows the supply curve?abcd
Brief Explanations
La curva de oferta muestra una relación directa entre el precio de un bien y la cantidad que los productores están dispuestos a vender: a mayor precio, mayor cantidad ofrecida. Esto se representa gráficamente con una línea ascendente de izquierda a derecha.

Snap & solve any problem in the app
Get step-by-step solutions on Sovi AI
Photo-based solutions with guided steps
Explore more problems and detailed explanations
A. [Gráfica con línea ascendente]