QUESTION IMAGE
Question
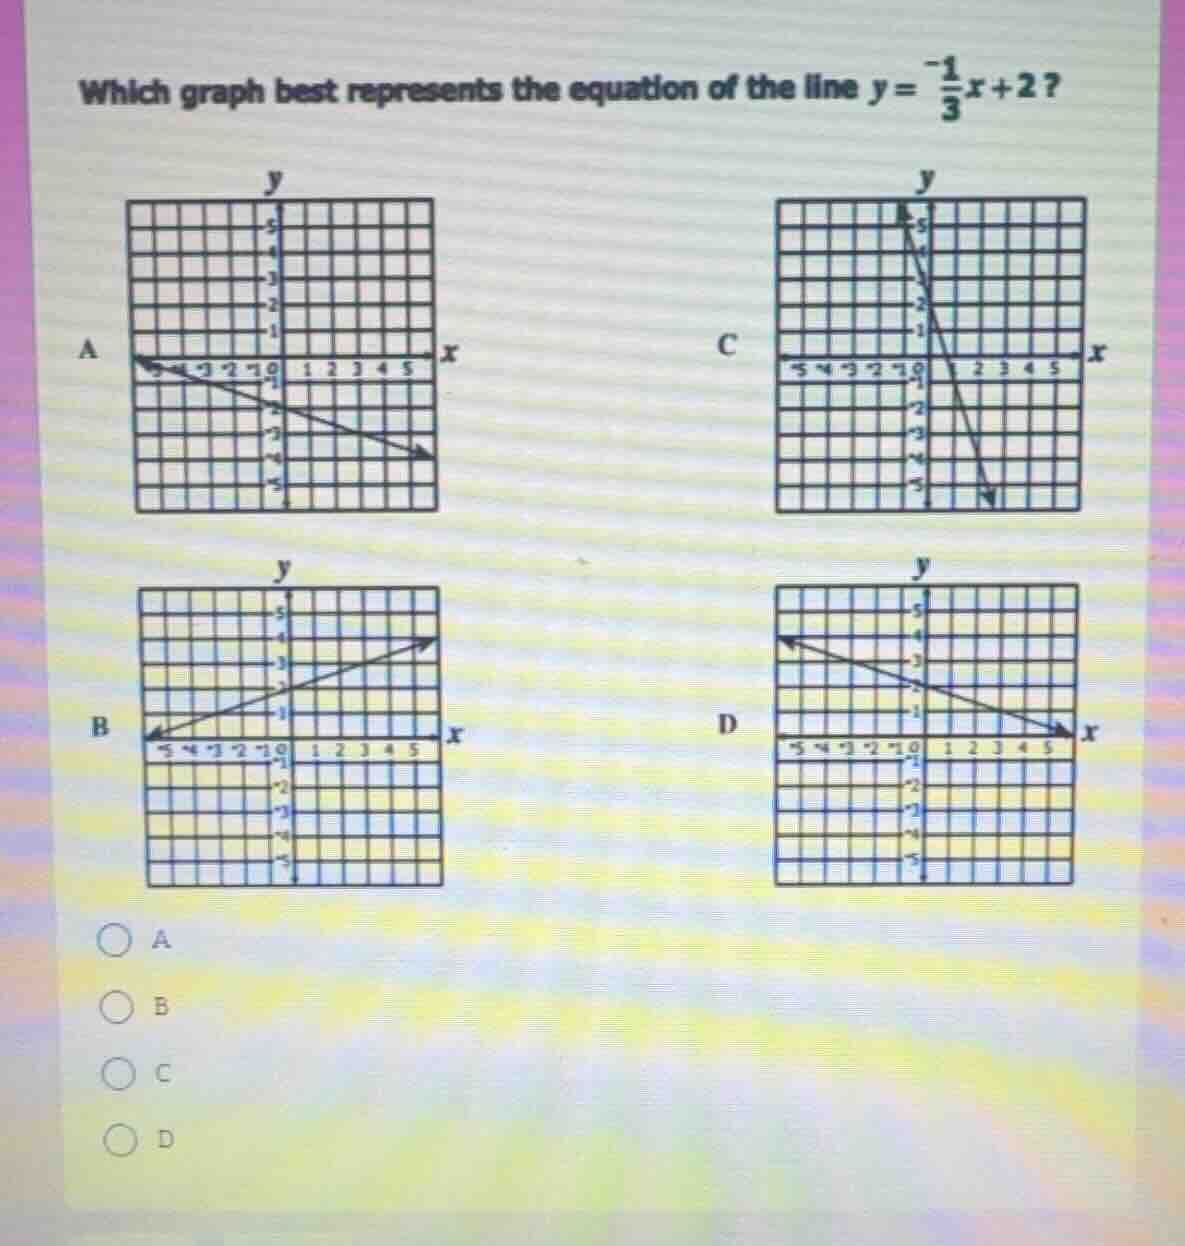
which graph best represents the equation of the line $y = -\frac{1}{3}x + 2$?
a
b
c
d
\bigcirc a
\bigcirc b
\bigcirc c
\bigcirc d
Step1: Analyze the slope and y-intercept
The equation of the line is given in slope - intercept form \(y = mx + b\), where \(m\) is the slope and \(b\) is the y - intercept. For the equation \(y=-\frac{1}{3}x + 2\), the slope \(m=-\frac{1}{3}\) (negative, so the line should be decreasing from left to right) and the y - intercept \(b = 2\) (the line crosses the y - axis at \((0,2)\)).
Step2: Analyze each option
- Option A: The line has a negative slope and crosses the y - axis at \((0, - 2)\). The y - intercept is incorrect, so A is not correct.
- Option B: The line has a positive slope (increasing from left to right), but our slope is negative. So B is not correct.
- Option C: The slope of the line is very steep (with a large magnitude of slope), but our slope is \(-\frac{1}{3}\) (a small magnitude of slope). So C is not correct.
- Option D: The line has a negative slope (decreasing from left to right) and crosses the y - axis at \((0,2)\), which matches the slope and y - intercept of the equation \(y =-\frac{1}{3}x+2\).

Snap & solve any problem in the app
Get step-by-step solutions on Sovi AI
Photo-based solutions with guided steps
Explore more problems and detailed explanations
D