QUESTION IMAGE
Question
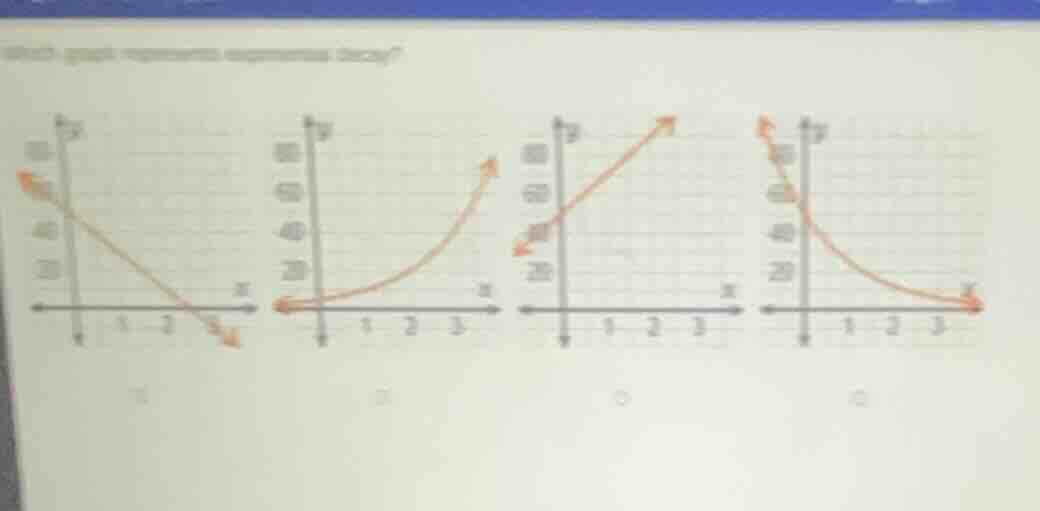
which graph represents exponential decay? (four graphs are shown with x and y axes, each with different curves. the first has a straight line decreasing, the second a curve increasing rapidly, the third a straight line increasing, the fourth a curve decreasing towards the x - axis.)
Exponential decay is characterized by a curve that starts at a high value, decreases rapidly at first, and slows down as x increases, approaching but never reaching the x-axis. The first graph is linear decay, the second and third are increasing functions (exponential growth and linear growth respectively). Only the fourth graph matches the shape of exponential decay.

Snap & solve any problem in the app
Get step-by-step solutions on Sovi AI
Photo-based solutions with guided steps
Explore more problems and detailed explanations
D. The fourth graph (curved decreasing line starting at high y-value, approaching x-axis)