QUESTION IMAGE
Question
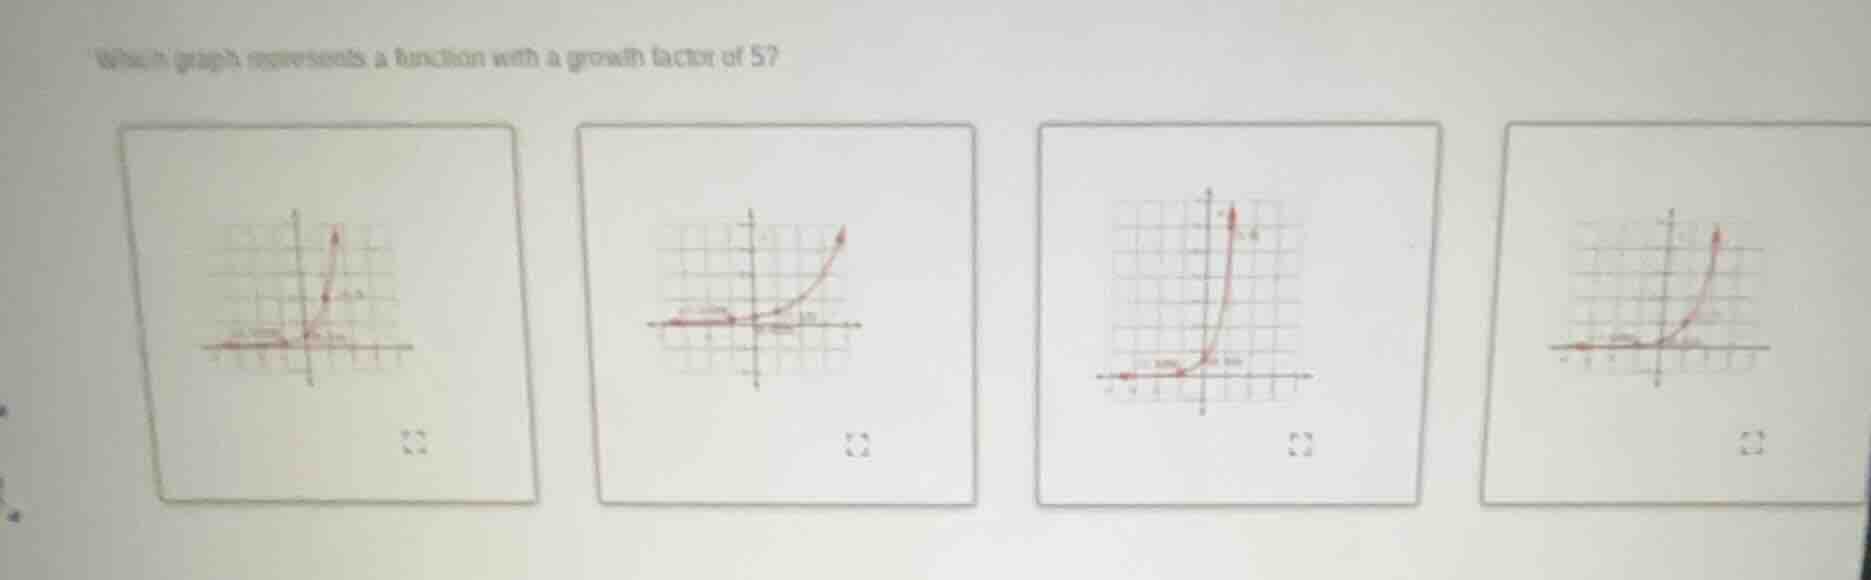
which graph represents a function with a growth factor of 5?
Step1: Recall exponential growth form
An exponential growth function has the form $f(x)=a(b)^x$, where $b$ is the growth factor ($b>1$). For a growth factor of 5, the function is $f(x)=a(5)^x$.
Step2: Test integer x-values
For $a=1$, calculate points:
- When $x=0$, $f(0)=5^0=1$
- When $x=1$, $f(1)=5^1=5$
- When $x=2$, $f(2)=5^2=25$
This means the graph rises very steeply: from (0,1) to (1,5) is a vertical jump of 4 units, which is much steeper than graphs with smaller growth factors (like growth factor 2, which goes from (0,1) to (1,2)).
Step3: Match steepness to graphs
Among the options, the third graph (left to right) shows the steepest upward curve that matches the rapid growth of $f(x)=5^x$.

Snap & solve any problem in the app
Get step-by-step solutions on Sovi AI
Photo-based solutions with guided steps
Explore more problems and detailed explanations
The third graph (left-to-right, the one with the steepest vertical rise from the x-axis)