QUESTION IMAGE
15,652 Learners found this answer helpful
Question
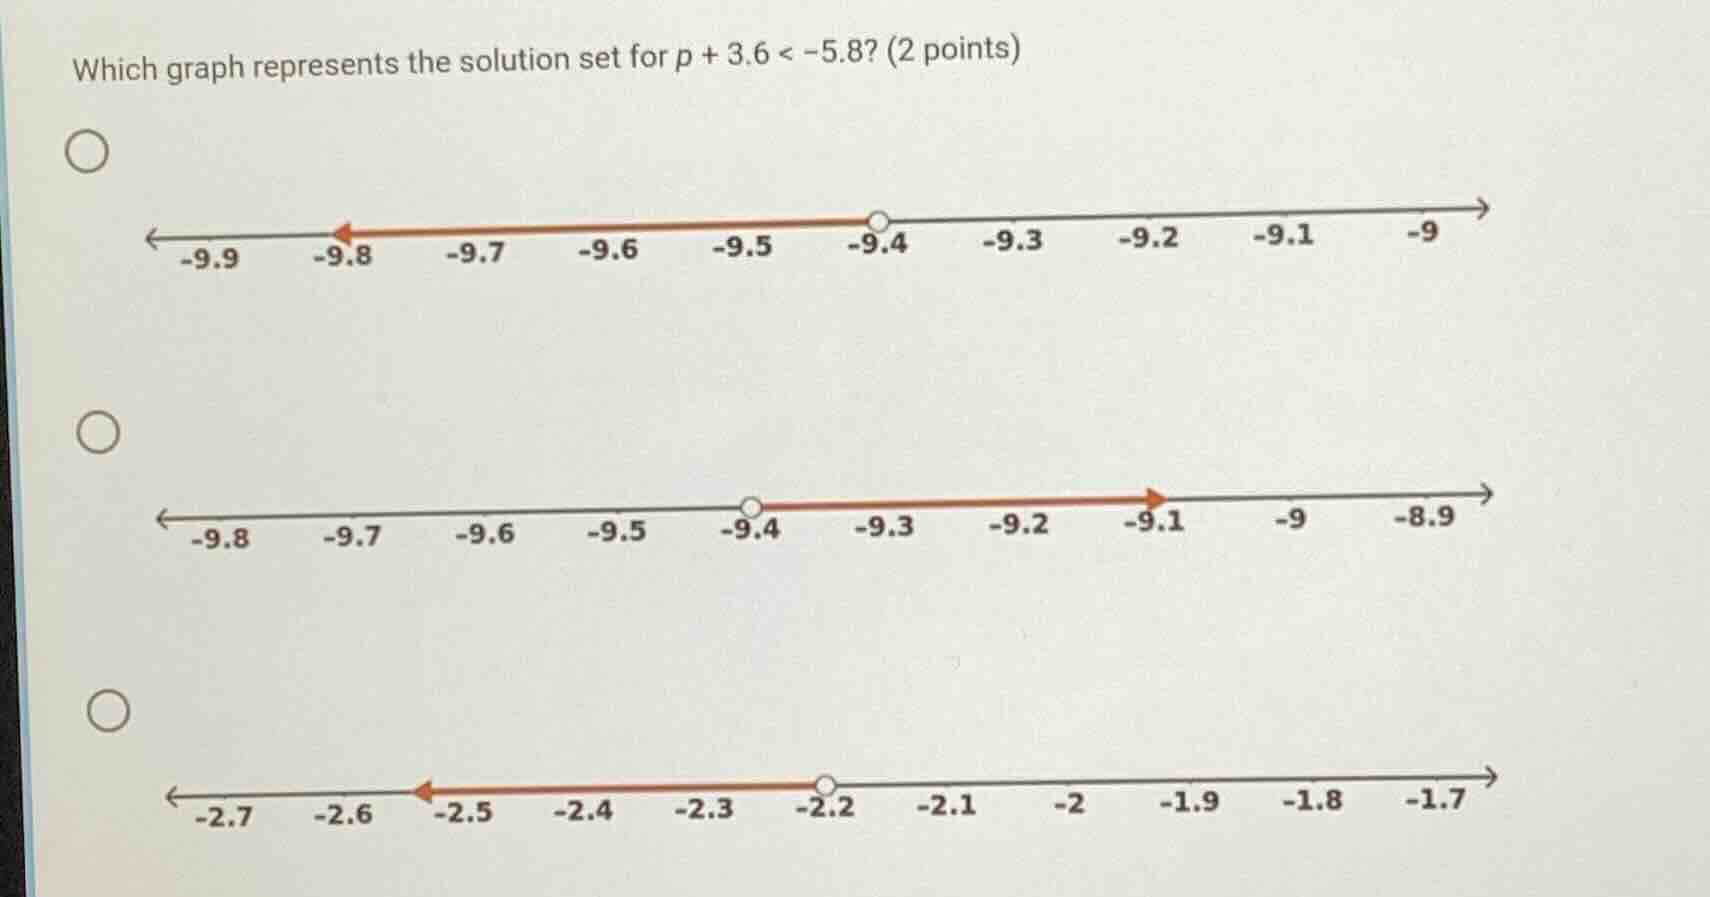
which graph represents the solution set for $p + 3.6 < -5.8$? (2 points)
Step1: Solve the inequality for \( p \)
To solve \( p + 3.6 < -5.8 \), we subtract \( 3.6 \) from both sides of the inequality.
\[
p + 3.6 - 3.6 < -5.8 - 3.6
\]
Step2: Simplify both sides
Simplifying the left side gives \( p \), and simplifying the right side: \( -5.8 - 3.6 = -9.4 \). So the solution is \( p < -9.4 \).
Step3: Analyze the number line graphs
- For a strict inequality (\( < \), not \( \leq \)), we use an open circle at \( -9.4 \).
- The solution \( p < -9.4 \) means we shade all values to the left of \( -9.4 \) on the number line.
Looking at the options:
- The first graph has an open circle at \( -9.4 \) and shading to the left (towards more negative numbers like \( -9.8, -9.9 \) etc.), which matches \( p < -9.4 \).
- The second graph shades to the right of \( -9.4 \), which would be for \( p > -9.4 \), not our solution.
- The third graph has numbers around \( -2.2 \) to \( -2.7 \), which is not related to our solution of \( p < -9.4 \).

Snap & solve any problem in the app
Get step-by-step solutions on Sovi AI
Photo-based solutions with guided steps
Explore more problems and detailed explanations
The first graph (with open circle at -9.4 and shading to the left towards -9.8, -9.9 etc.)