QUESTION IMAGE
Question
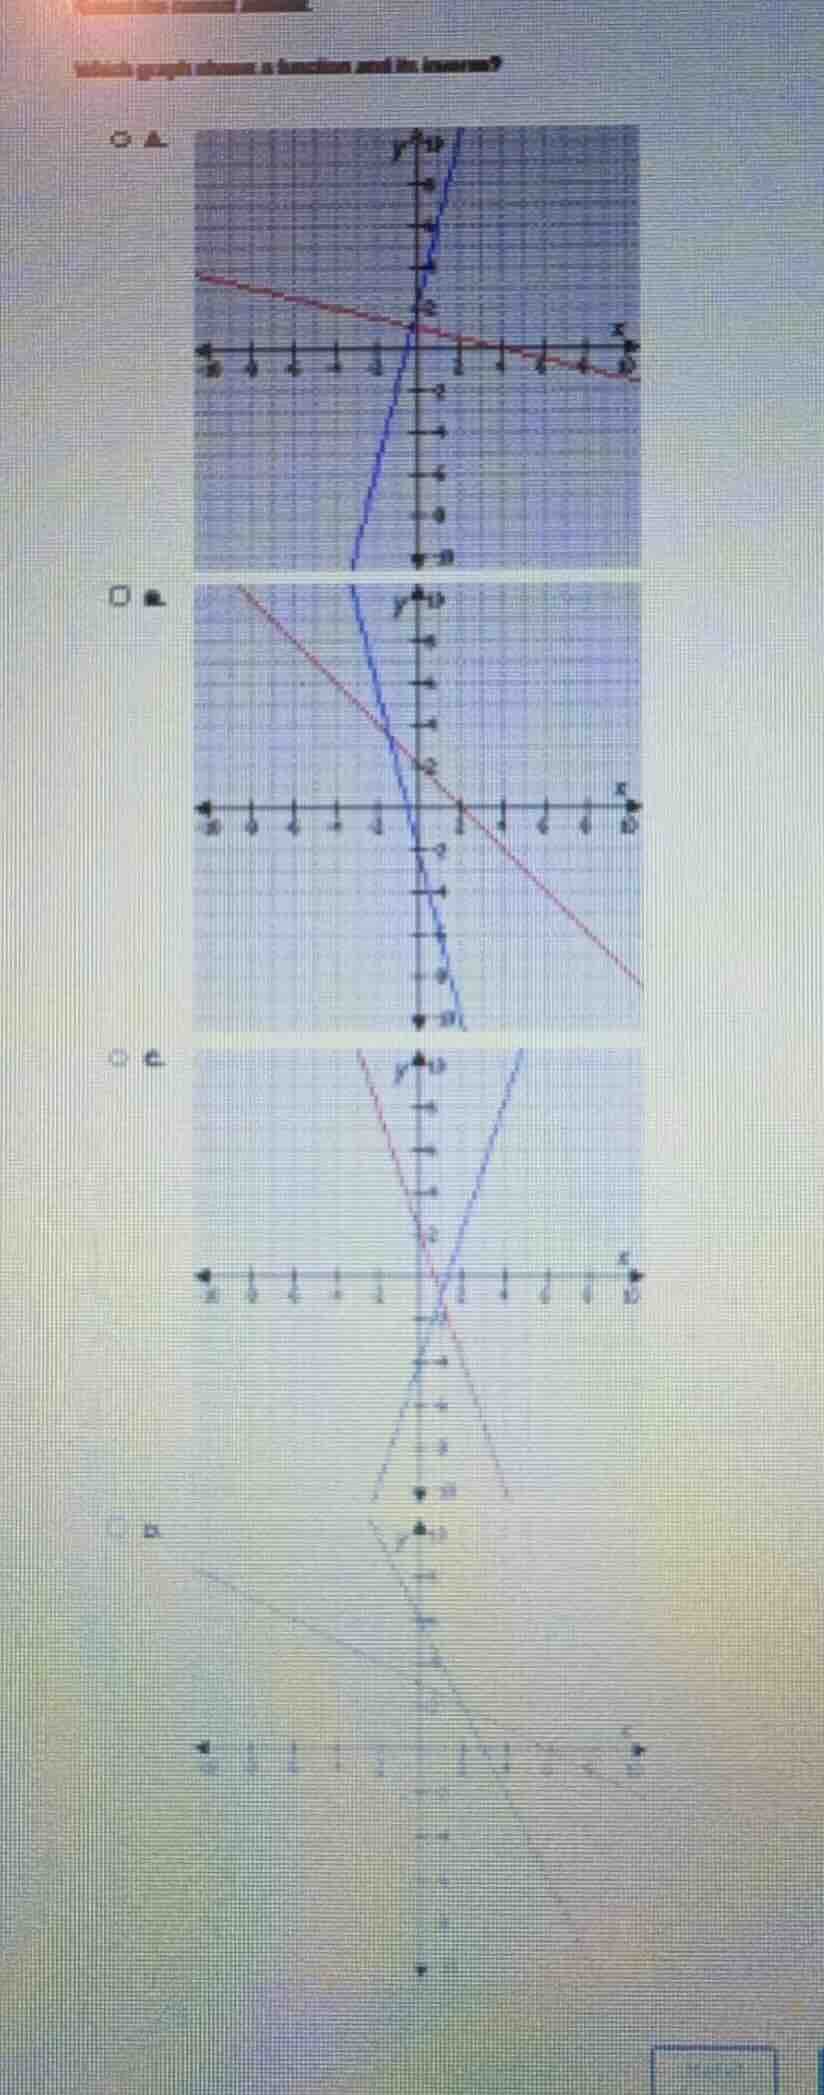
which graph shows a function and its inverse?
options are labeled a, b, c, d with corresponding graphs (omitted here as per ocr text processing for images).
To determine which graph shows a function and its inverse, we use the property that a function and its inverse are symmetric about the line \( y = x \). Also, for a function and its inverse, if \( (a,b) \) is on the function, then \( (b,a) \) should be on the inverse. Additionally, we can use the vertical line test (for the function) and the horizontal line test (for the inverse, since the inverse of a function is a function only if the original function is one - to - one).
Step 1: Recall the properties of a function and its inverse
- A function \( f(x) \) and its inverse \( f^{-1}(x) \) are symmetric with respect to the line \( y=x \).
- A function must pass the vertical line test (no vertical line intersects the graph more than once). The inverse of a function (which is also a function) must pass the horizontal line test (no horizontal line intersects the graph of the original function more than once, meaning the original function is one - to - one).
Step 2: Analyze each option (by visual inspection)
- Option A: The two lines do not seem to be symmetric about \( y = x \). One line has a very steep slope and the other has a shallow slope, and their shapes do not reflect the symmetry property of a function and its inverse.
- Option B: The two lines appear to be symmetric about the line \( y=x \). Let's assume the red line is the function \( y = f(x) \) and the blue line is \( y=f^{-1}(x) \). If we take a point on the red line, say, when \( x = 0 \), \( y=2 \) (from the graph). Then on the blue line, when \( x = 2 \), \( y = 0 \), which is consistent with the symmetry about \( y=x \) (the point \( (0,2) \) on the function should correspond to \( (2,0) \) on the inverse). Also, both lines pass the vertical line test (for the function) and the horizontal line test (for the inverse, since the original function is linear and has a non - zero slope, so it is one - to - one).
- Option C: The two lines (the red and blue) do not show the symmetry about \( y=x \). Their intersection and slope relationships do not match the expected symmetry of a function and its inverse.
- Option D: The graph (from the visual) does not show two lines that are symmetric about \( y = x \) and the shape does not conform to the properties of a function and its inverse.

Snap & solve any problem in the app
Get step-by-step solutions on Sovi AI
Photo-based solutions with guided steps
Explore more problems and detailed explanations
B (the graph in option B)