QUESTION IMAGE
Question
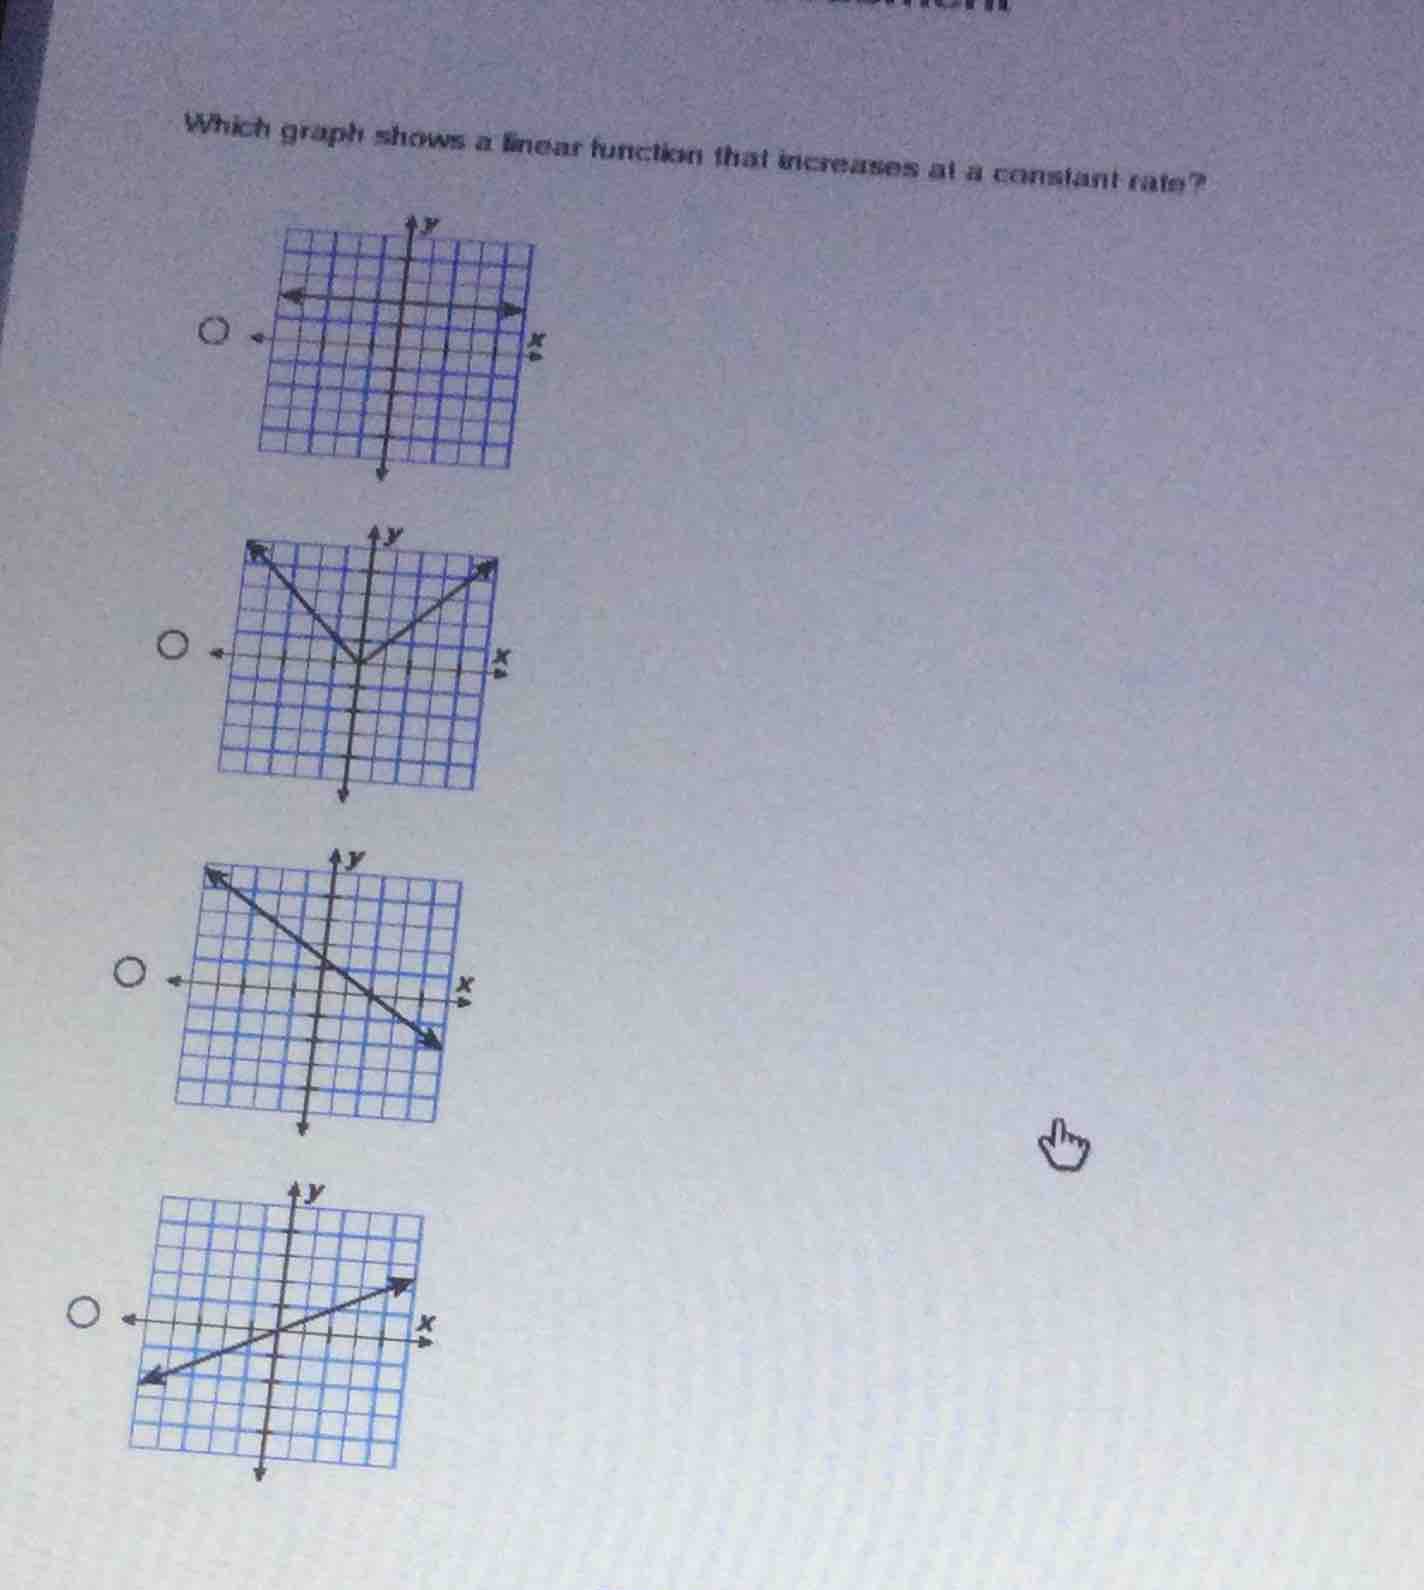
which graph shows a linear function that increases at a constant rate?
Step1: Recall linear function properties
A linear function has the form $y = mx + b$, where $m$ (slope) determines the rate of change. A constant increasing rate means a positive, constant slope (straight line with positive slope, not changing steepness).
Step2: Analyze each graph
- First graph: Vertical line (not a function, fails vertical line test, and not increasing at constant rate in x - direction).
- Second graph: V - shaped (absolute value function, not linear (piecewise linear, but slope changes sign), so rate of increase/decrease changes).
- Third graph: Negative slope (decreasing, not increasing).
- Fourth graph: Straight line with positive slope (constant positive slope, so increases at constant rate).

Snap & solve any problem in the app
Get step-by-step solutions on Sovi AI
Photo-based solutions with guided steps
Explore more problems and detailed explanations
The fourth graph (the one with the line having a positive slope, going from bottom - left to top - right, passing through the origin - like area with a constant steepness) shows a linear function that increases at a constant rate. If we consider the options as labeled (assuming the last one is, say, Option D), the answer is the graph with the positively sloped straight line (the bottom - most graph in the given set).