QUESTION IMAGE
Question
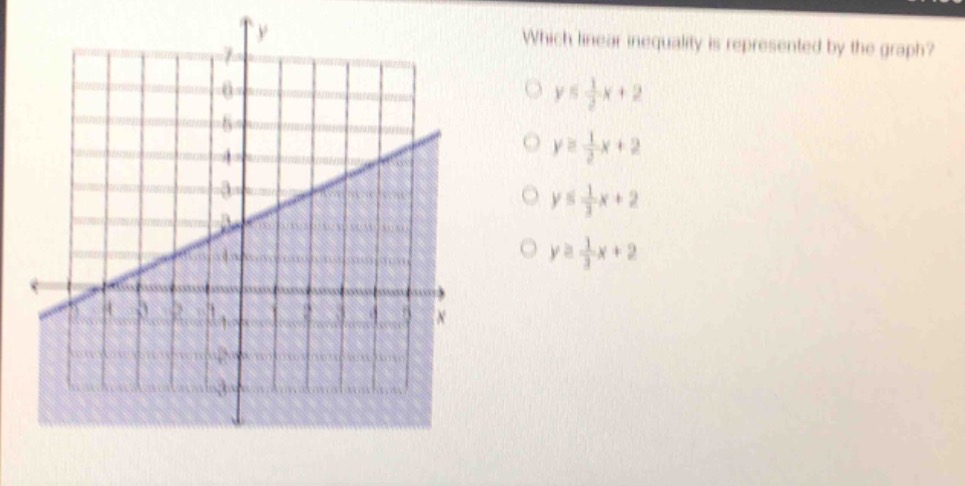
which linear inequality is represented by the graph?
$y\leq \frac{1}{2}x + 2$
$y\geq \frac{1}{2}x + 2$
$y\leq \frac{1}{3}x + 2$
$y\geq \frac{1}{3}x + 2$
Step1: Find slope of boundary line
Identify two points on the line: $(0,2)$ and $(4,4)$. Slope formula: $m=\frac{y_2-y_1}{x_2-x_1}$
$m=\frac{4-2}{4-0}=\frac{2}{4}=\frac{1}{2}$
Step2: Get line equation
Use y-intercept $b=2$ (from point $(0,2)$). Line equation: $y=\frac{1}{2}x+2$
Step3: Determine inequality sign
Shaded region is below the solid line, so use $\leq$.

Snap & solve any problem in the app
Get step-by-step solutions on Sovi AI
Photo-based solutions with guided steps
Explore more problems and detailed explanations
$y \leq \frac{1}{2}x + 2$ (Option 1: $y \leq \frac{1}{2}x + 2$)