QUESTION IMAGE
Question
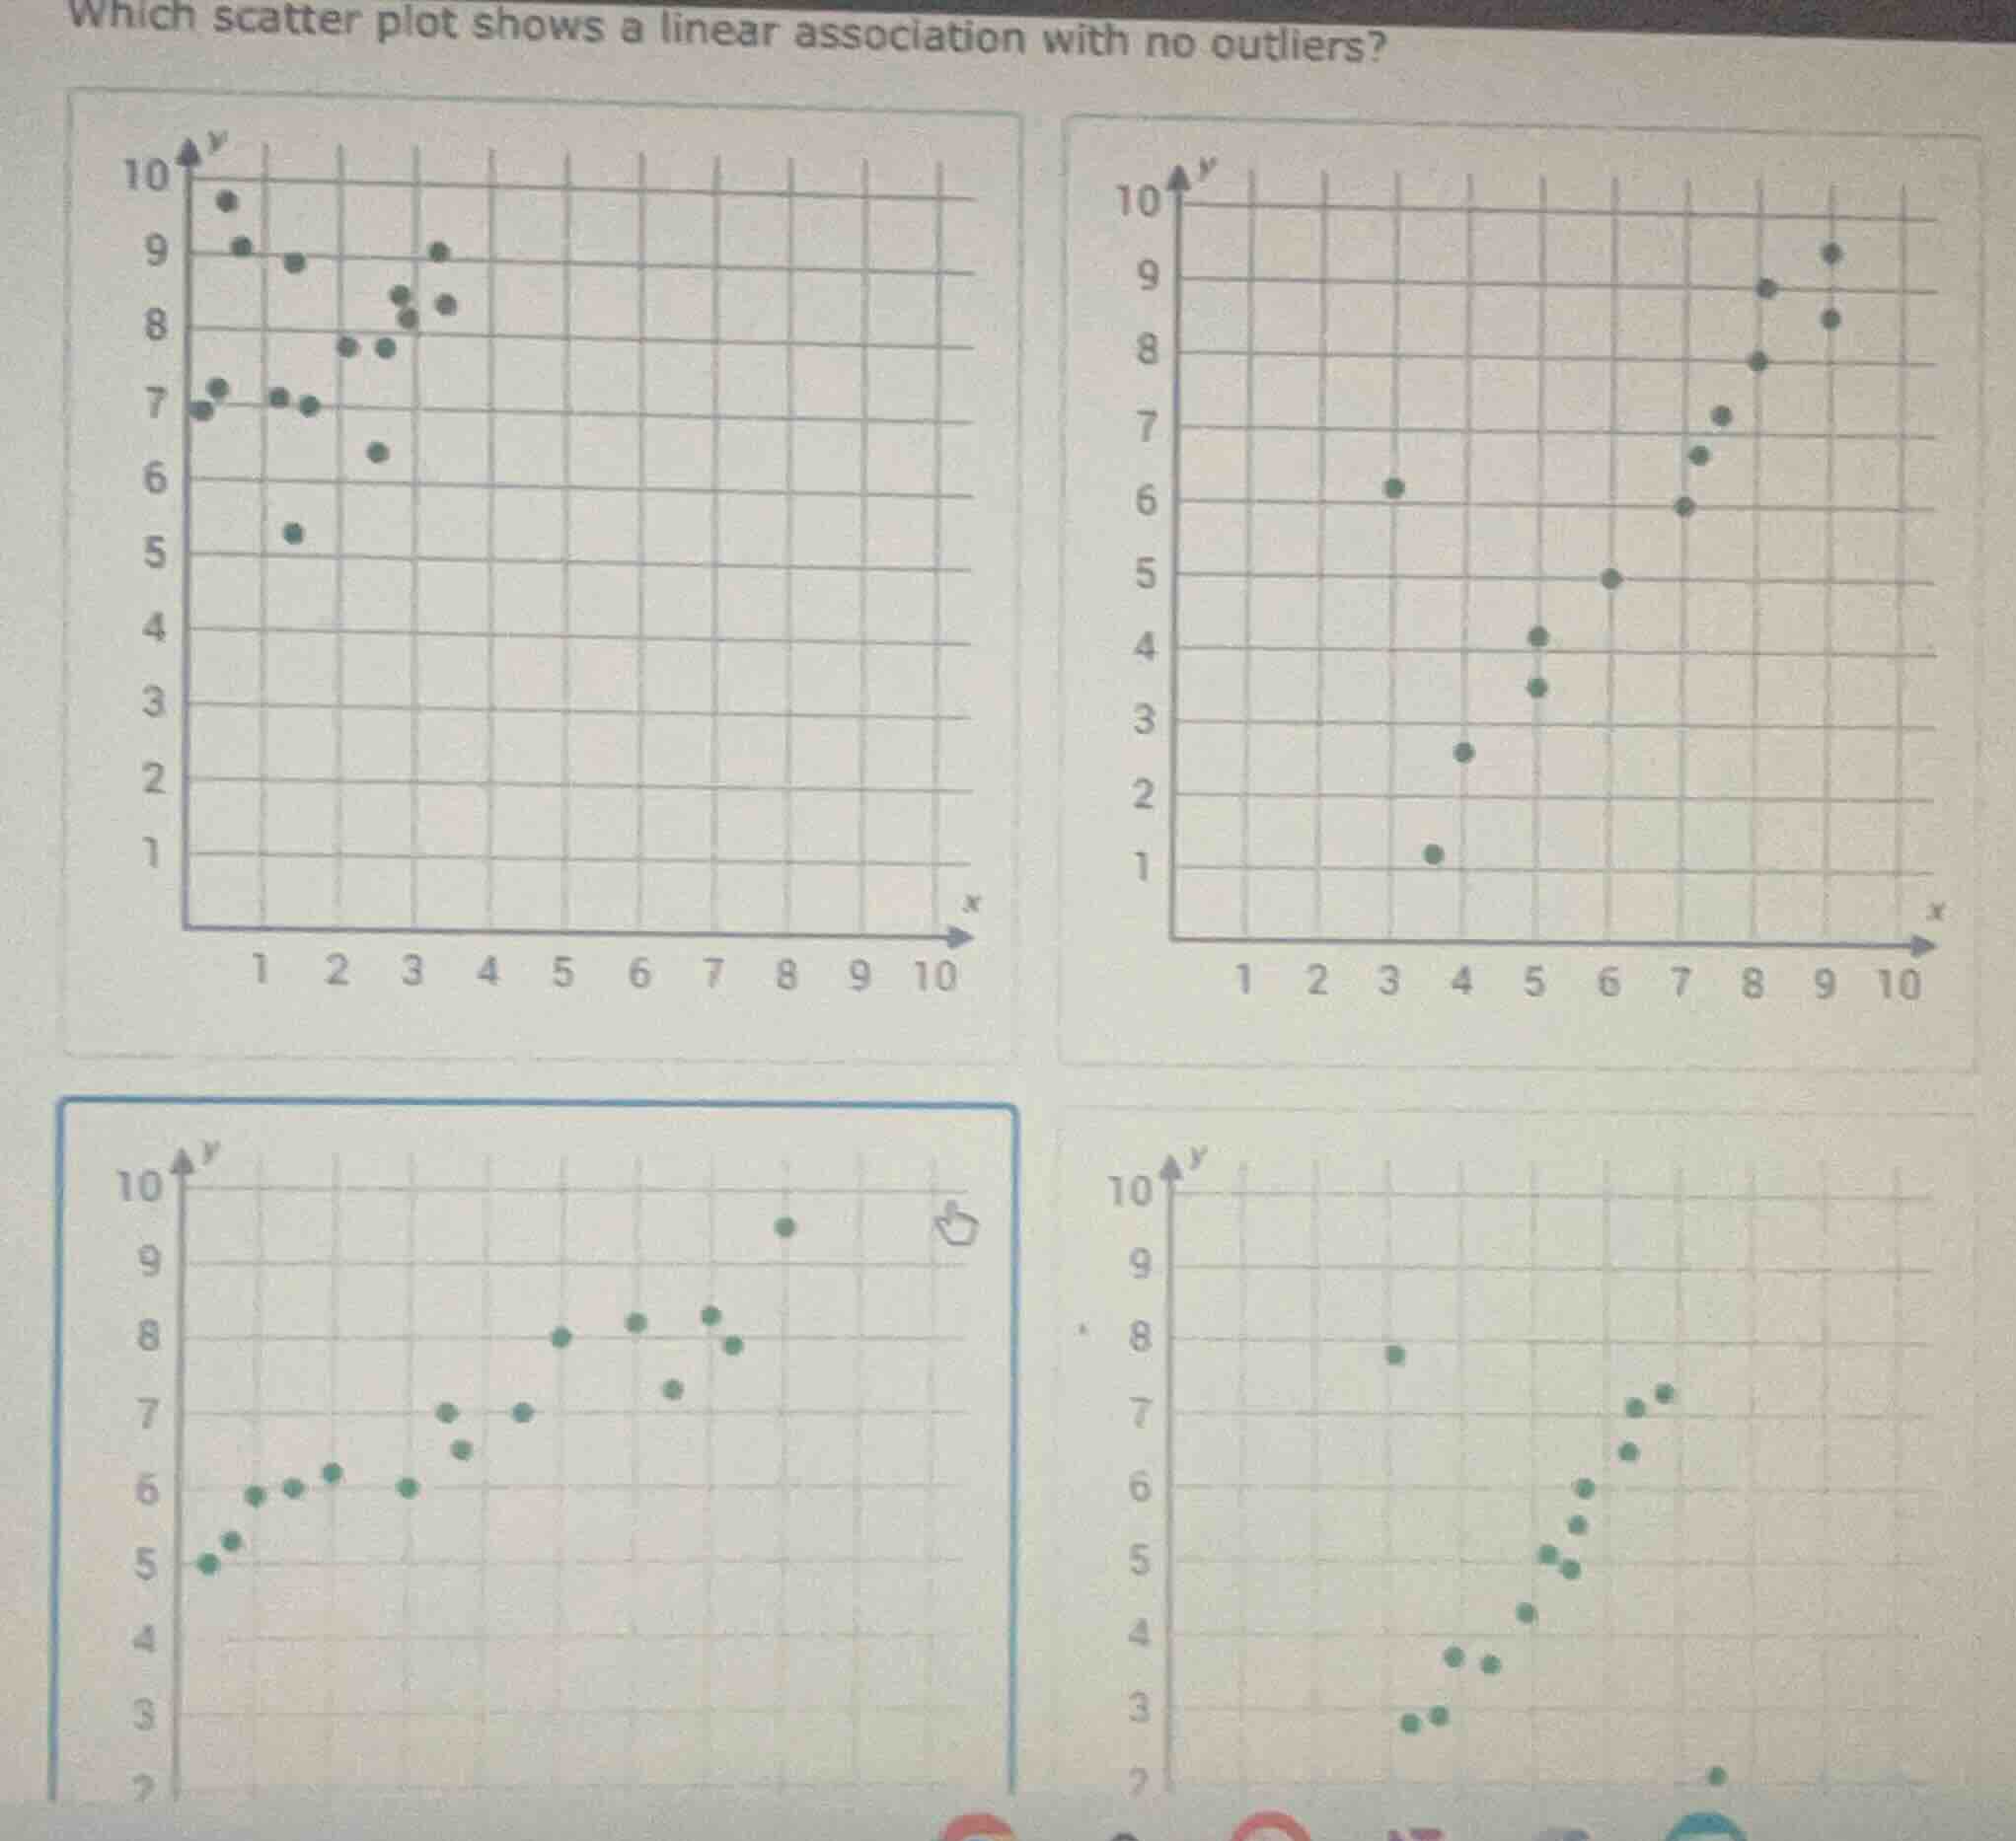
which scatter plot shows a linear association with no outliers?
Brief Explanations
- Top-left plot: Data points have no clear upward/downward linear trend, and there are points far from the main cluster (outliers).
- Top-right plot: While it has a positive linear trend, there are points (like the one at x=3, y=1) that are far from the main pattern (outliers).
- Bottom-left plot: Data points follow a clear, steady upward linear trend, and all points are close to the implied line with no points far outside the main cluster.
- Bottom-right plot: The points curve, showing a non-linear trend, and there is a clear outlier at the bottom right.

Snap & solve any problem in the app
Get step-by-step solutions on Sovi AI
Photo-based solutions with guided steps
Explore more problems and detailed explanations
The bottom-left scatter plot (the one with the blue border)