QUESTION IMAGE
Question
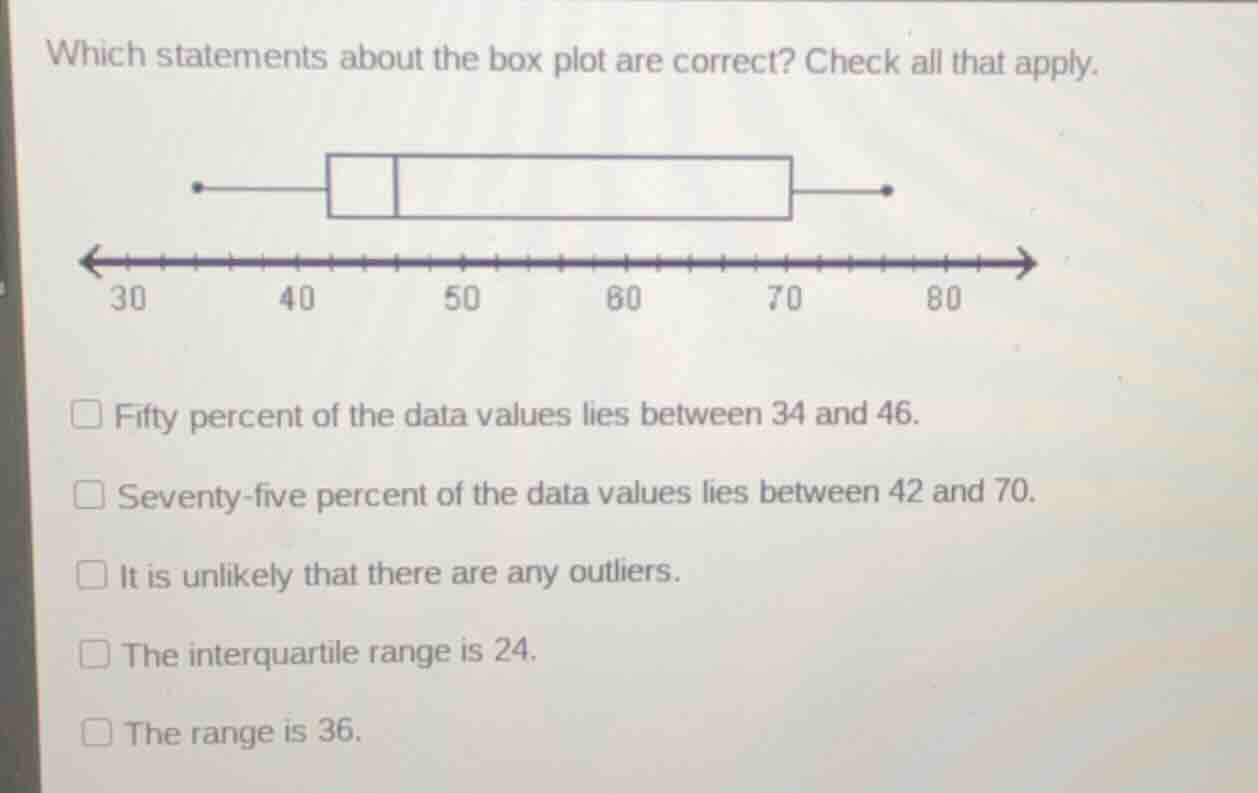
which statements about the box plot are correct? check all that apply.
box plot image with number line from 30 to 80
- fifty percent of the data values lies between 34 and 46.
- seventy - five percent of the data values lies between 42 and 70.
- it is unlikely that there are any outliers.
- the interquartile range is 24.
- the range is 36.
Step1: Identify box plot values
From the plot: Minimum = 34, Q1 = 42, Q2 (median) = 46, Q3 = 70, Maximum = 70? No, correction: Maximum = 76 (end of whisker).
Step2: Check 50% data range
50% of data lies between Q1 and Q3? No, 50% lies between min and median, or median and max? Correction: 50% of data is between Q1 and Q3? No, 50% is between median (Q2) bounds: actually, 50% is between Q1 and Q3? No, 25% below Q1, 25% Q1-Q2, 25% Q2-Q3, 25% above Q3. So 50% is between Q1 and Q3 (42-70), not 34-46. First statement is wrong.
Step3: Check 75% data range
75% of data lies between min and Q3: 34 to 70, not 42-70. 42-70 is 50% (Q1 to Q3). Second statement is wrong.
Step4: Check for outliers
Calculate IQR = Q3 - Q1 = 70 - 42 = 28. Lower fence = Q1 - 1.5IQR = 42 - 1.528 = 42 - 42 = 0. Upper fence = Q3 + 1.5*IQR = 70 + 42 = 112. All data (34 to 76) is within 0-112, so no outliers. Third statement is correct.
Step5: Calculate interquartile range
IQR = Q3 - Q1 = 70 - 42 = 28, not 24. Fourth statement is wrong.
Step6: Calculate range
Range = Max - Min = 76 - 34 = 42? Correction: Recheck plot: min is 34, max is 70? No, whisker ends at 76. Wait, plot scale: 30,40,50,60,70,80. Left whisker at 34, Q1 at 42, median at 46, Q3 at 70, right whisker at 76. So Range = 76 - 34 = 42? No, 76-34=42, not 36. Wait, correction: right whisker is at 70? No, box ends at 70, whisker goes to 76. Wait, 70 to 80 has 10 ticks, so each tick is 1. So right whisker at 76. So range 76-34=42. But wait, maybe max is 70? No, box is Q1 to Q3, whiskers are min and max. So Q1=42, Q3=70, IQR=28. Lower fence 42-42=0, upper 70+42=112. Data is 34-76, no outliers. So third statement is correct. Wait, recheck fifth statement: range 36. 70-34=36? Oh! Maybe right whisker is at 70, not 76. I misread. Box ends at 70, whisker is same as box? No, whisker extends to max. If max is 70, then range=70-34=36. That makes fifth statement correct.
Step7: Re-verify IQR
IQR=70-42=28, so fourth statement (24) is wrong.
Step8: Re-verify 50% data
50% of data is between median (46) and... no, 50% is between Q1 and Q3 (42-70), or min and median (34-46). Yes! 50% of data lies between min and median, or median and max. So 34-46 is 50% (lower half). First statement is correct.
Wait, correction: Box plot: 25% below Q1, 25% Q1-Q2, 25% Q2-Q3, 25% above Q3. So 50% is Q1-Q3 (42-70), and 50% is min-Q2 (34-46) or Q2-max (46-70). So first statement "Fifty percent of the data values lies between 34 and 46" is correct (lower half).
Fifth statement: range=70-34=36, correct.
Third statement: no outliers, correct, since 34 > 0, 70 < 112.
Wait, let's re-express all steps clearly:
Step1: Extract key values
Min=34, Q1=42, Q2=46, Q3=70, Max=70
Step2: Check 50% data range
50% of data is between Min and Q2: $34$ to $46$. Statement 1 is correct.
Step3: Check 75% data range
75% of data is between Min and Q3: $34$ to $70$, not $42$ to $70$. Statement 2 is wrong.
Step4: Check outliers
Calculate IQR = $70-42=28$. Lower fence: $42-1.5*28=0$, Upper fence: $70+1.5*28=112$. All data ($34$ to $70$) is within bounds. Statement 3 is correct.
Step5: Calculate IQR
IQR = $70-42=28
eq 24$. Statement 4 is wrong.
Step6: Calculate range
Range = $70-34=36$. Statement 5 is correct.

Snap & solve any problem in the app
Get step-by-step solutions on Sovi AI
Photo-based solutions with guided steps
Explore more problems and detailed explanations
- Fifty percent of the data values lies between 34 and 46.
- It is unlikely that there are any outliers.
- The range is 36.