QUESTION IMAGE
Question
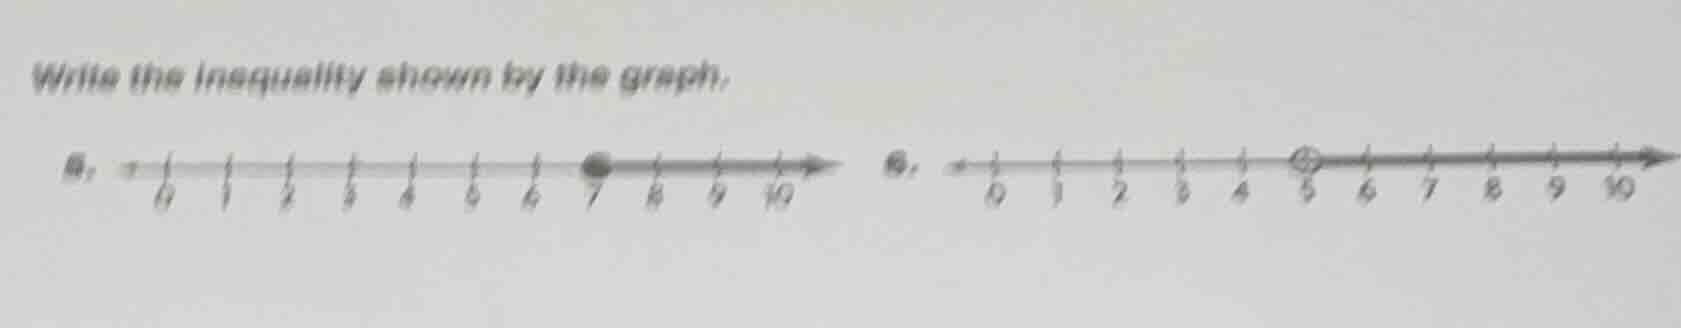
write the inequality shown by the graph.
Step1: Analyze first number line
The graph has a closed dot at 7, meaning 7 is included, and the arrow points right (values greater than or equal to 7).
Inequality: $x \geq 7$
Step2: Analyze second number line
The graph has an open dot at 5, meaning 5 is not included, and the arrow points right (values greater than 5).
Inequality: $x > 5$

Snap & solve any problem in the app
Get step-by-step solutions on Sovi AI
Photo-based solutions with guided steps
Explore more problems and detailed explanations
- $x \geq 7$
- $x > 5$