QUESTION IMAGE
Question
yesterday
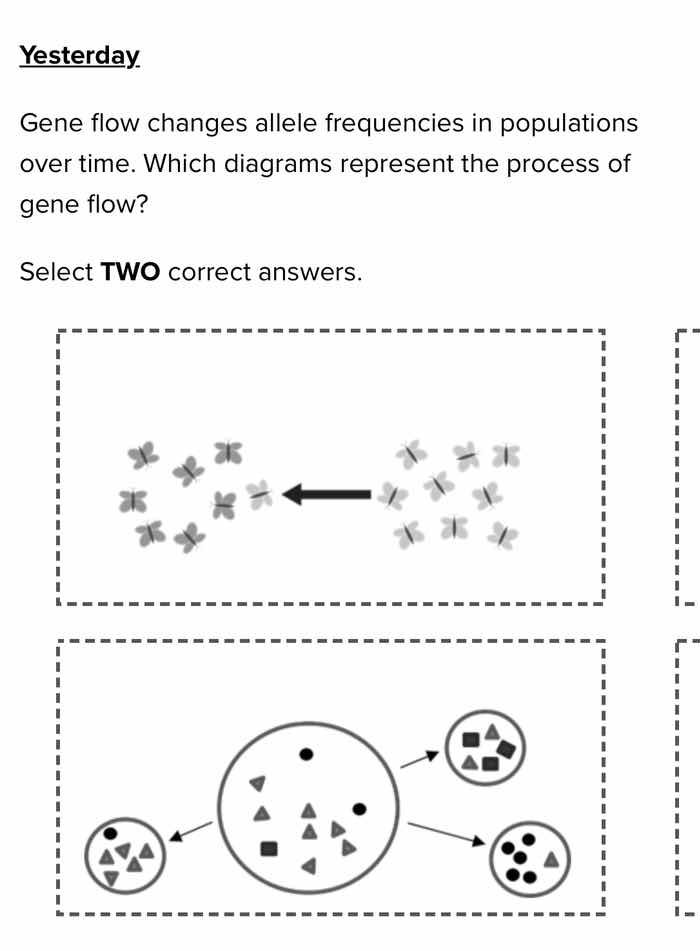
gene flow changes allele frequencies in populations over time. which diagrams represent the process of gene flow?
select two correct answers.
diagram 1: two groups of butterflies, one group with mostly gray butterflies and one with mostly light gray butterflies, with an arrow from the light gray group to the gray group
diagram 2: a large circle with various shapes and smaller circles around it, with arrows indicating movement between them
Gene flow is the transfer of genetic material (alleles) between populations. The first diagram shows individuals (butterflies) moving from one population to another, which is gene flow. The second diagram shows a central population transferring genetic elements (symbols) to other populations, also representing gene flow. Other diagrams (not fully shown) likely don't depict this transfer.

Snap & solve any problem in the app
Get step-by-step solutions on Sovi AI
Photo-based solutions with guided steps
Explore more problems and detailed explanations
The two diagrams representing gene flow are:
- The diagram with butterflies (one population of butterflies moving into another population).
- The diagram with the central circle (containing different symbols) and arrows to/from smaller circles (transferring genetic elements between populations).