QUESTION IMAGE
Question
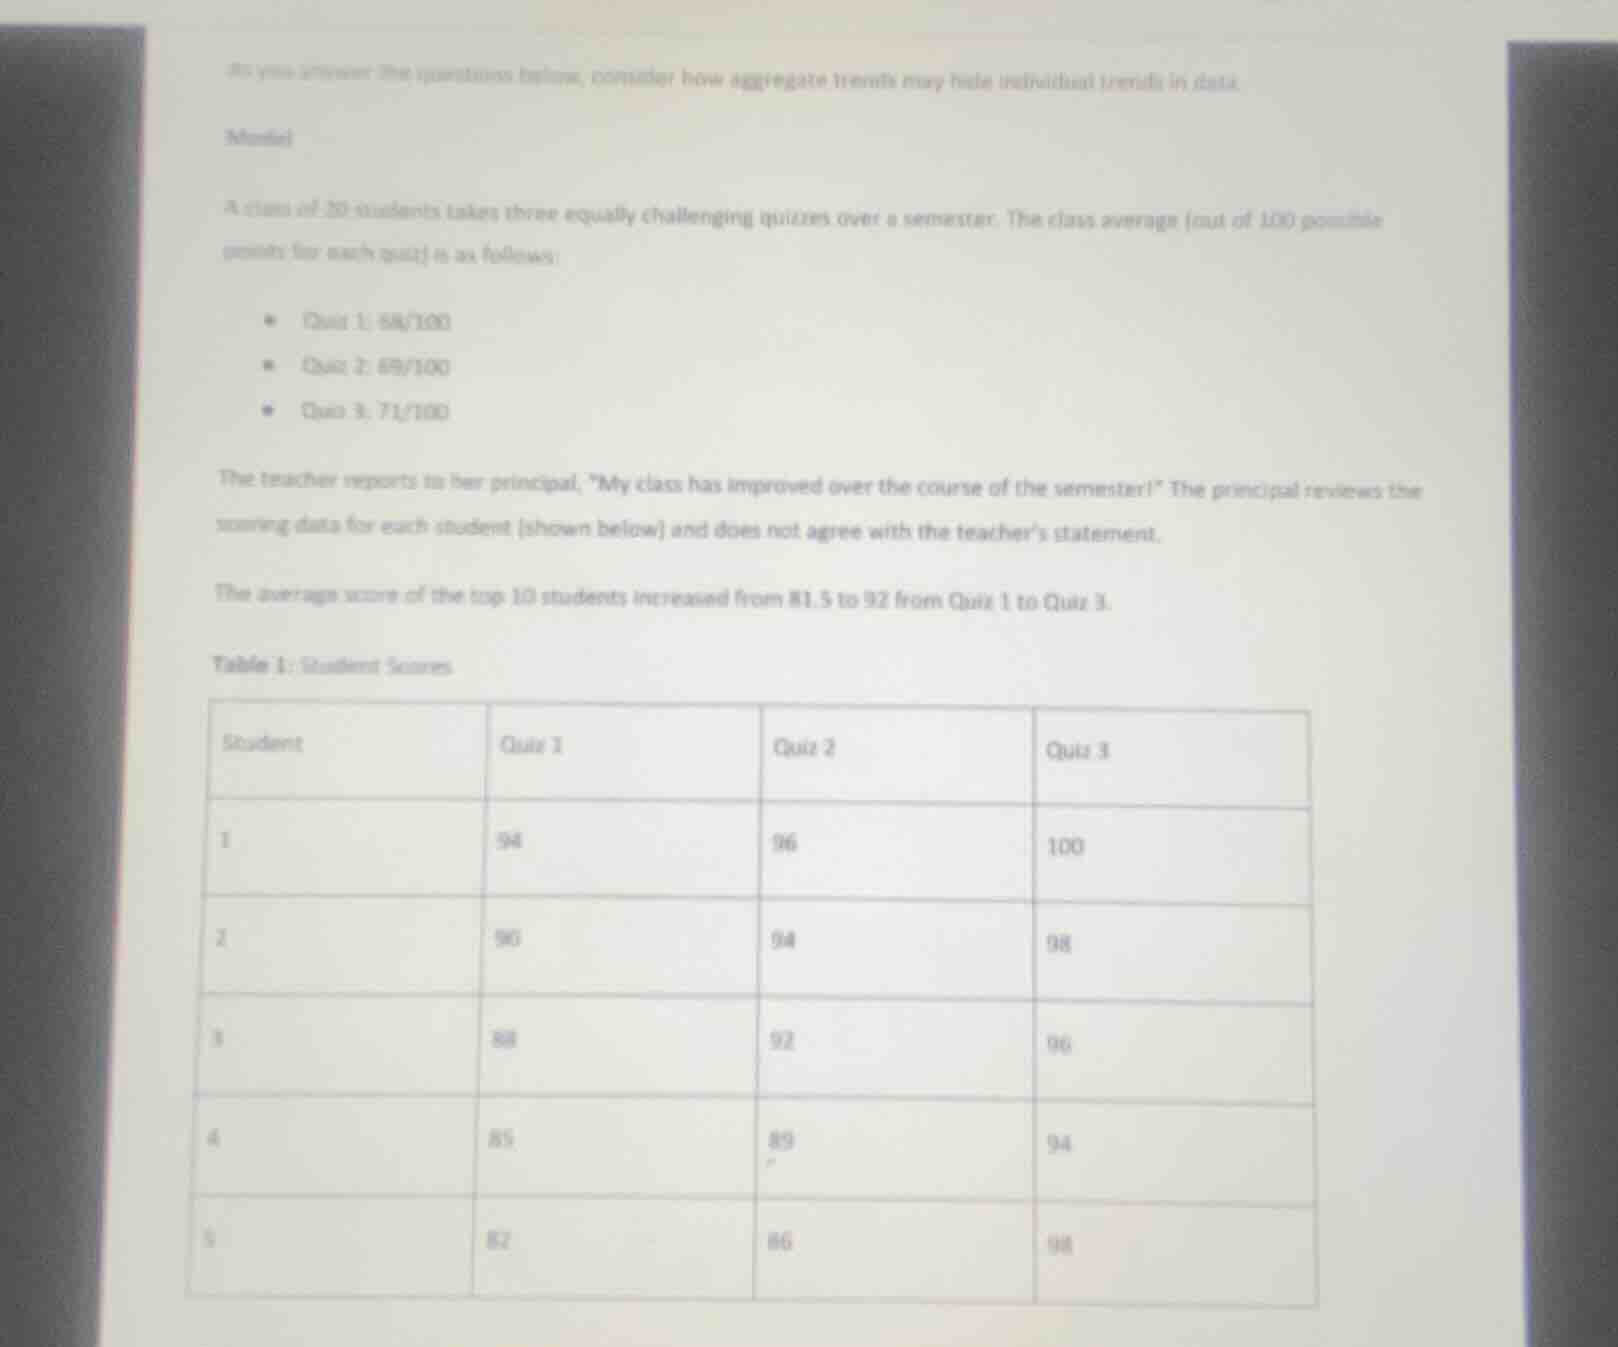
as you answer the questions below, consider how aggregate trends may hide individual trends in data.
model
a class of 30 students takes three equally challenging quizzes over a semester. the class average (out of 100 possible points for each quiz) is as follows:
- quiz 1: 58/100
- quiz 2: 69/100
- quiz 3: 71/100
the teacher reports to her principal, \my class has improved over the course of the semester!\ the principal reviews the scoring data for each student (shown below) and does not agree with the teacher’s statement.
the average score of the top 10 students increased from 81.5 to 92 from quiz 1 to quiz 3.
table 1: student scores
table with columns: student, quiz 1, quiz 2, quiz 3; rows for student 1 - 5 with scores: 1: 94, 96, 100; 2: 90, 94, 98; 3: 88, 92, 96; 4: 85, 89, 94; 5: 82, 86, 90
Since the problem is not fully presented (the table of student scores seems incomplete and the specific question is missing), we can't provide a solution yet. However, based on the context, this appears to be a problem related to understanding how aggregate (class - level) and individual (student - level) trends can differ, which is a concept in Statistics (subfield of Mathematics) or Education (subfield of Social Science). If we assume the question is about explaining why the principal disagrees with the teacher, here is a possible approach:
Step - by - Step Explanation (if the question is to explain the discrepancy)
Step 1: Analyze Aggregate Trend
The class averages are \(58/100\) (Quiz 1), \(69/100\) (Quiz 2), and \(71/100\) (Quiz 3). So, the aggregate (class - level) trend shows an increase in average scores over the three quizzes.
Step 2: Analyze Individual Trends (especially for non - top students)
We know the top 10 students' average increased from \(81.5\) to \(92\). But for the remaining \(20 - 10=10\) students (assuming a class of 30? Wait, the problem says a class of 30 students? Wait, the initial statement says "A class of 30 students..." but the table shows 5 students. Maybe a typo, but assuming the class has 30 students, 10 top and 20 non - top? Or 20 students? The problem statement has a mix - up. But generally, the principal likely saw that while the top students' scores increased, the scores of the lower - performing students may have decreased or not increased enough to justify the overall class improvement claim, or the distribution of scores changed in a way that the aggregate increase is due to the top students, while the majority of students (non - top) may not have improved. For example, if we calculate the total points for the class:
- For Quiz 1: Let the total points of top 10 students be \(10\times81.5 = 815\). Let the total points of the remaining \(n\) students be \(T_1\). The class average is \(58\), so total class points for Quiz 1 is \(N\times58\) (where \(N\) is the number of students, say \(N = 30\), so \(30\times58=1740\)). Then \(T_1=1740 - 815 = 925\), and the average of the remaining students is \(\frac{925}{20}\approx46.25\) (if \(N = 30\) and top 10).
- For Quiz 3: Total points of top 10 students is \(10\times92 = 920\). Total class points for Quiz 3 is \(30\times71 = 2130\). Then the total points of the remaining students is \(2130 - 920 = 1210\), and the average of the remaining students is \(\frac{1210}{20}=60.5\). Wait, that still shows an increase. But maybe the non - top students' individual scores decreased or had a different trend. If we look at the sample students in the table (even though it's incomplete), Student 1 - 5 (top students?) have increasing scores. But for the other students, maybe their scores decreased. For example, if there are students with scores like 30, 40, 50 in Quiz 1, and 25, 35, 45 in Quiz 2, and 20, 30, 40 in Quiz 3, their scores are decreasing, while the top students' scores are increasing. So the aggregate increase is due to the top students, but the majority of students (non - top) are not improving.
Since the problem is not fully specified, we can't give a definite answer. But the key concept is the difference between aggregate and individual trends, which is a statistical concept related to the Simpson's paradox (a phenomenon in statistics where a trend appears in different groups of data but disappears or reverses when the groups are combined) or just the idea that overall averages can be misleading when the distribution of data (e.g., the…
The teacher used the class average (aggregate trend) to claim improvement. However, the principal analyzed individual student data. The top 10 students' scores increased, but the scores of the remaining students (likely lower - performing) may have decreased or not improved enough. The aggregate increase in class average is driven by the top students' improvement, while the majority of students (non - top) may not have improved. This is an example of how aggregate trends can mask individual (sub - group) trends, a concept related to data distribution and statistical analysis.

Snap & solve any problem in the app
Get step-by-step solutions on Sovi AI
Photo-based solutions with guided steps
Explore more problems and detailed explanations
The principal disagrees because the class average increase (aggregate trend) is driven by the top 10 students' score improvement, while the scores of the non - top students may not have improved (or even decreased), so the overall "improvement" claim based on class average is misleading as it doesn't reflect the performance of most students.