QUESTION IMAGE
Question
(02.01 mc)
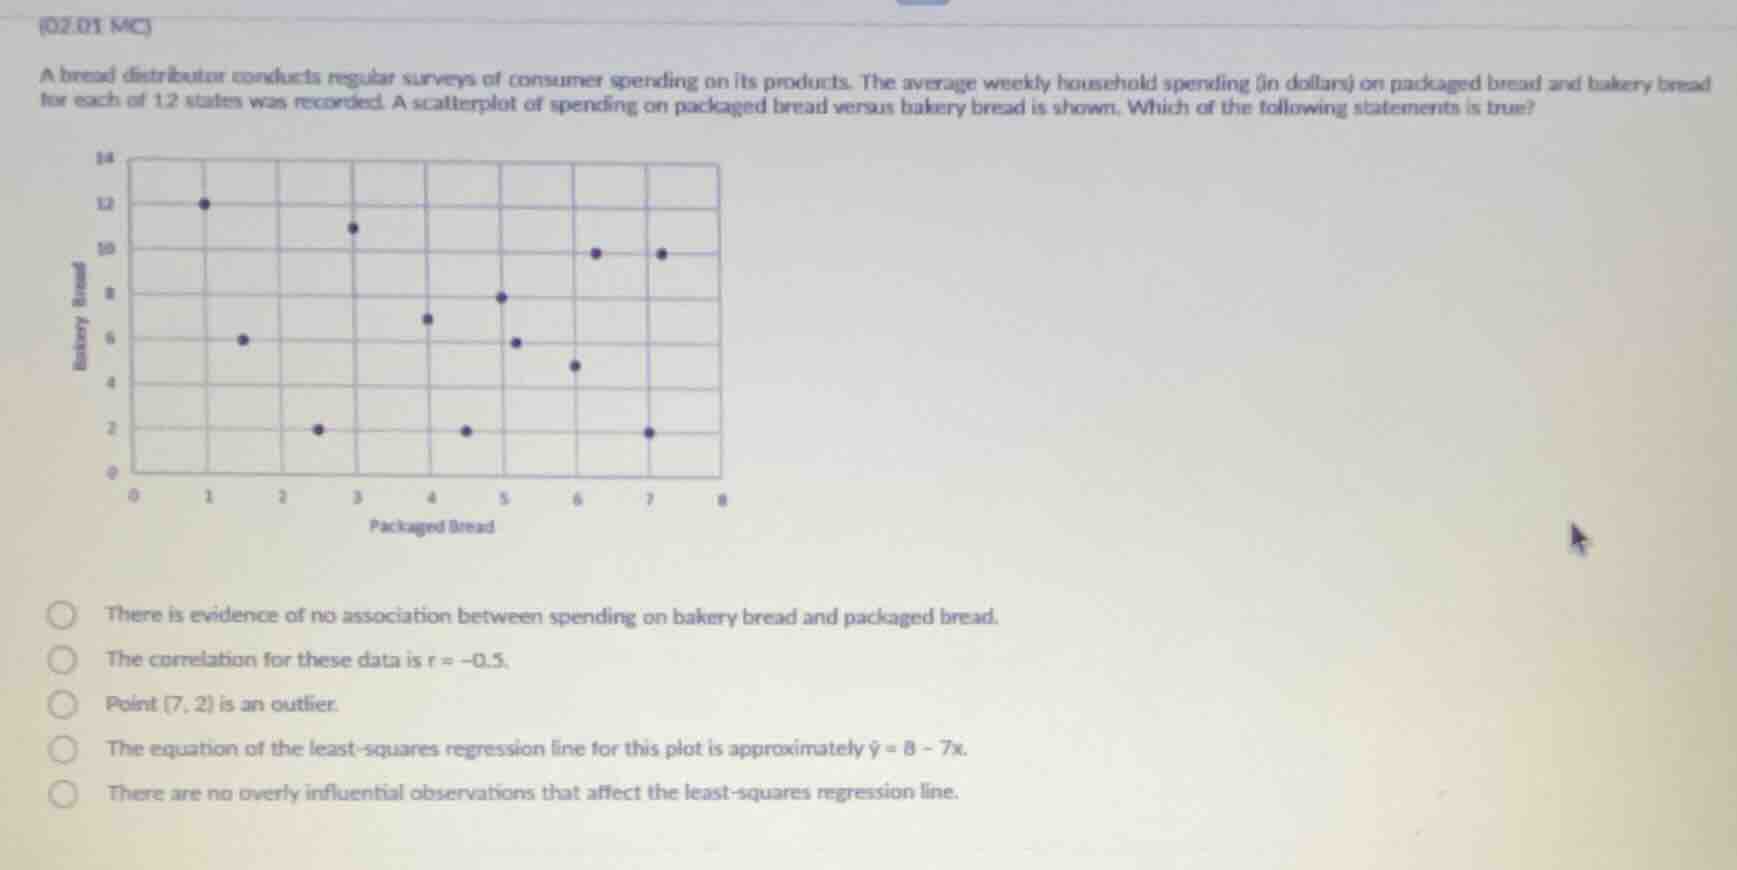
a bread distributor conducts regular surveys of consumer spending on its products. the average weekly household spending (in dollars) on packaged bread and bakery bread for each of 12 states was recorded. a scatterplot of spending on packaged bread versus bakery bread is shown. which of the following statements is true?
scatterplot image
options:
- there is evidence of no association between spending on bakery bread and packaged bread.
- the correlation for these data is r = -0.5.
- point (7, 2) is an outlier.
- the equation of the least - squares regression line for this plot is approximately ŷ = 8 - 7x.
- there are no overly influential observations that affect the least - squares regression line.
Brief Explanations
- Analyze the first option: The scatterplot shows a negative trend (as packaged bread spending increases, bakery bread spending tends to decrease), so there is an association. Eliminate this option.
- Analyze the second option: The negative trend is strong, so the correlation \( r \) should be closer to -1, not -0.5. Eliminate this option.
- Analyze the third option: Point (7, 2) is far from the general pattern of the other points (most points follow a negative trend, and (7, 2) has a much lower bakery bread spending than expected for \( x = 7 \) based on the trend). So it is an outlier.
- Analyze the fourth option: The slope of \( -7 \) would mean a very steep negative line, but the scatterplot's trend is not that steep. Eliminate this option.
- Analyze the fifth option: Point (7, 2) is an outlier and could be overly influential, so this is false. Eliminate this option.

Snap & solve any problem in the app
Get step-by-step solutions on Sovi AI
Photo-based solutions with guided steps
Explore more problems and detailed explanations
C. Point (7, 2) is an outlier.