QUESTION IMAGE
Question
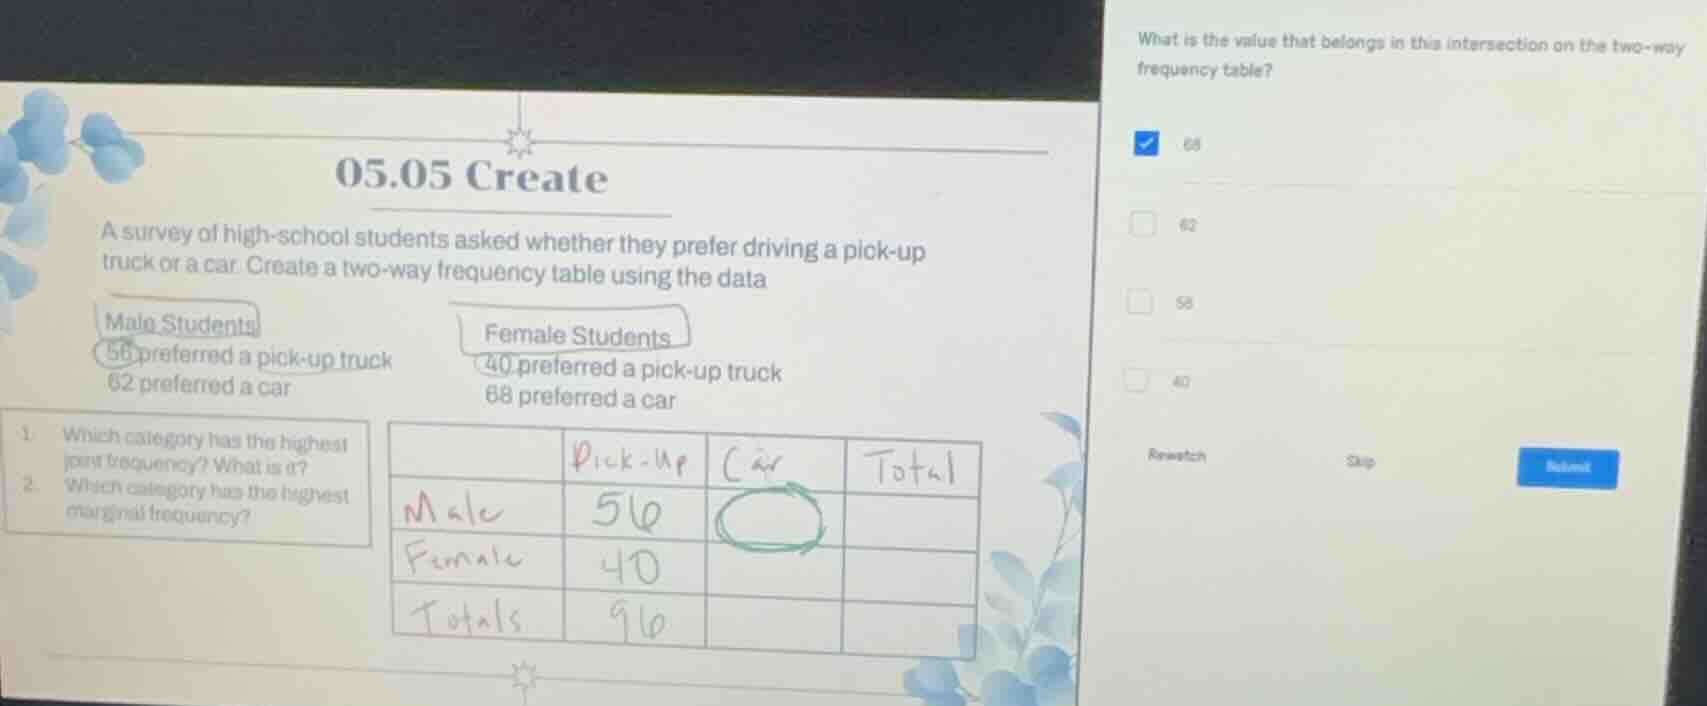
05.05 create
a survey of high-school students asked whether they prefer driving a pick-up truck or a car. create a two-way frequency table using the data
male students
56 preferred a pick-up truck
62 preferred a car
female students
40 preferred a pick-up truck
68 preferred a car
- which category has the highest joint frequency? what is it?
- which category has the highest marginal frequency?
pick-up car total
male 56
female 40
totals 90
what is the value that belongs in this intersection on the two-way frequency table?
66
62
58
40
Step1: Identify target cell value
The empty cell is for male students who prefer cars, which is given directly in the survey data.
Step2: Extract the matching data
From "Male Students: 62 preferred a car", we get the value.

Snap & solve any problem in the app
Get step-by-step solutions on Sovi AI
Photo-based solutions with guided steps
Explore more problems and detailed explanations
62