QUESTION IMAGE
Question
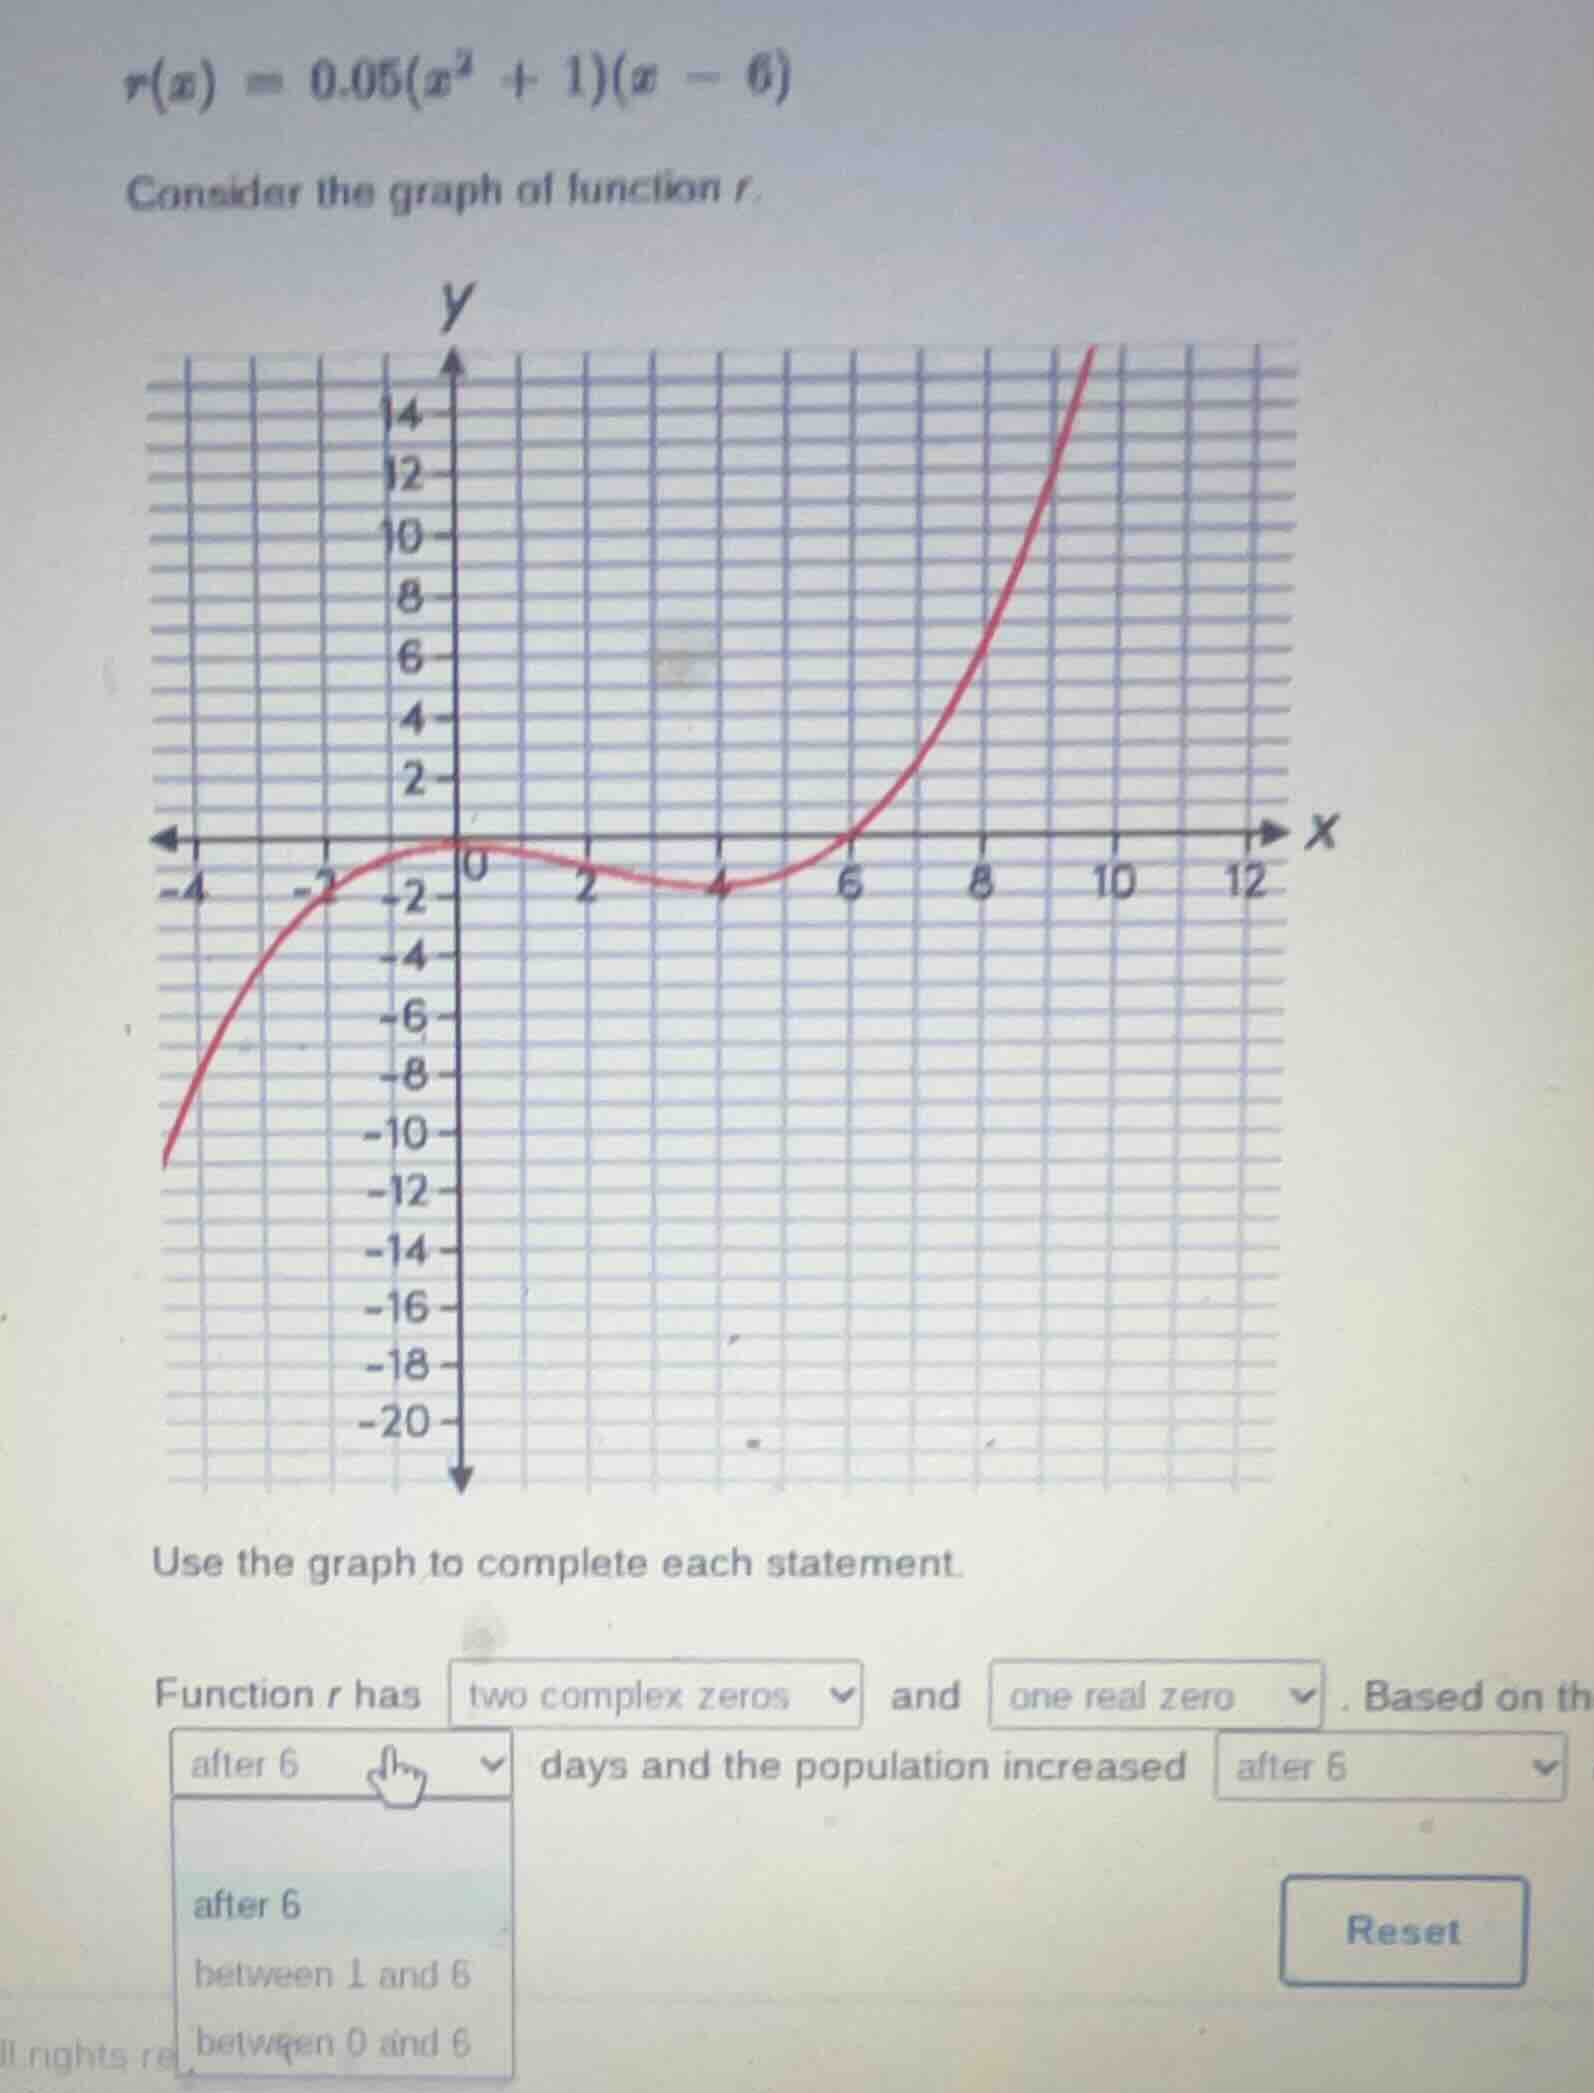
r(x) = 0.05(x² + 1)(x - 6)
consider the graph of function r.
use the graph to complete each statement.
function r has two complex zeros and one real zero. based on thcut off after 6 days and the population increased after 6cut off
Step1: Identify real/complex zeros
To find zeros, set $r(x)=0$:
$0.05(x^2 + 1)(x - 6)=0$
$x^2+1=0$ gives $x=\pm i$ (complex); $x-6=0$ gives $x=6$ (real).
Step2: Analyze population change from graph
For $x<6$, the graph is below/near the x-axis (negative values, population decreasing). For $x>6$, the graph rises sharply (positive values, population increasing). So population decreased before $x=6$, specifically between 0 and 6, and increased after 6.

Snap & solve any problem in the app
Get step-by-step solutions on Sovi AI
Photo-based solutions with guided steps
Explore more problems and detailed explanations
Function $r$ has two complex zeros and one real zero. Based on the graph, the population decreased between 0 and 6 days and the population increased after 6 days.