QUESTION IMAGE
Question
- directions
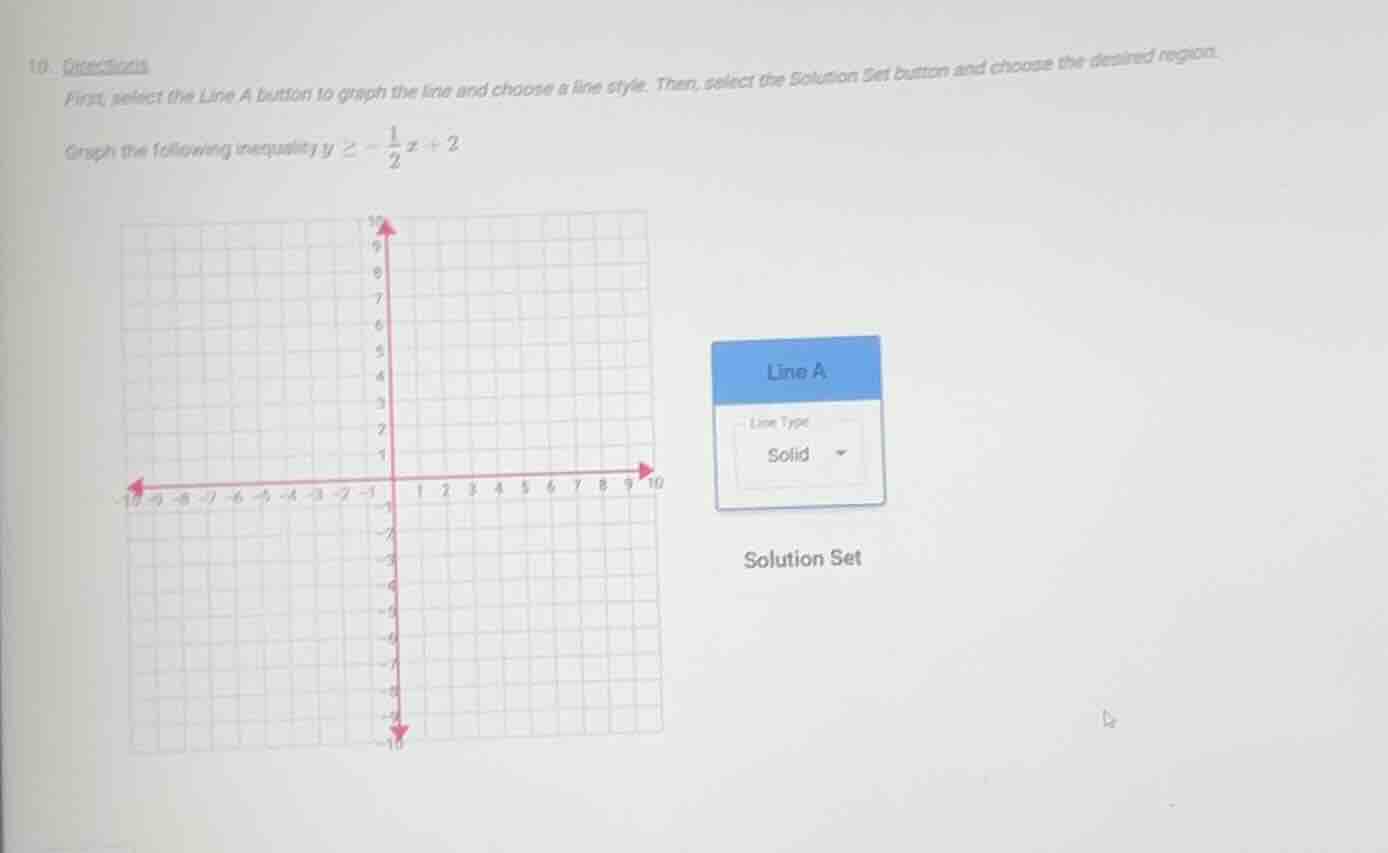
first, select the line a button to graph the line and choose a line style. then, select the solution set button and choose the desired region.
graph the following inequality ( y geq -\frac{1}{2}x + 2 )
(there is a coordinate grid image and a line a settings box with solid line type and solution set label)
Step1: Identify line type
The inequality is $y \geq -\frac{1}{2}x + 2$. Since the symbol is $\geq$ (includes equality), use a solid line.
Step2: Find intercepts of the line
For y-intercept: Set $x=0$, $y = -\frac{1}{2}(0) + 2 = 2$. So point $(0,2)$.
For x-intercept: Set $y=0$, $0 = -\frac{1}{2}x + 2$
$\frac{1}{2}x = 2$
$x = 4$. So point $(4,0)$.
Step3: Plot the line
Draw a solid line through $(0,2)$ and $(4,0)$.
Step4: Determine solution region
Test a point not on the line, e.g., $(0,0)$:
$0 \geq -\frac{1}{2}(0) + 2$ → $0 \geq 2$, which is false. So shade the region above the solid line.

Snap & solve any problem in the app
Get step-by-step solutions on Sovi AI
Photo-based solutions with guided steps
Explore more problems and detailed explanations
- Draw a solid line connecting the points $(0, 2)$ and $(4, 0)$ on the coordinate grid.
- Shade the entire region that lies above this solid line.