QUESTION IMAGE
Question
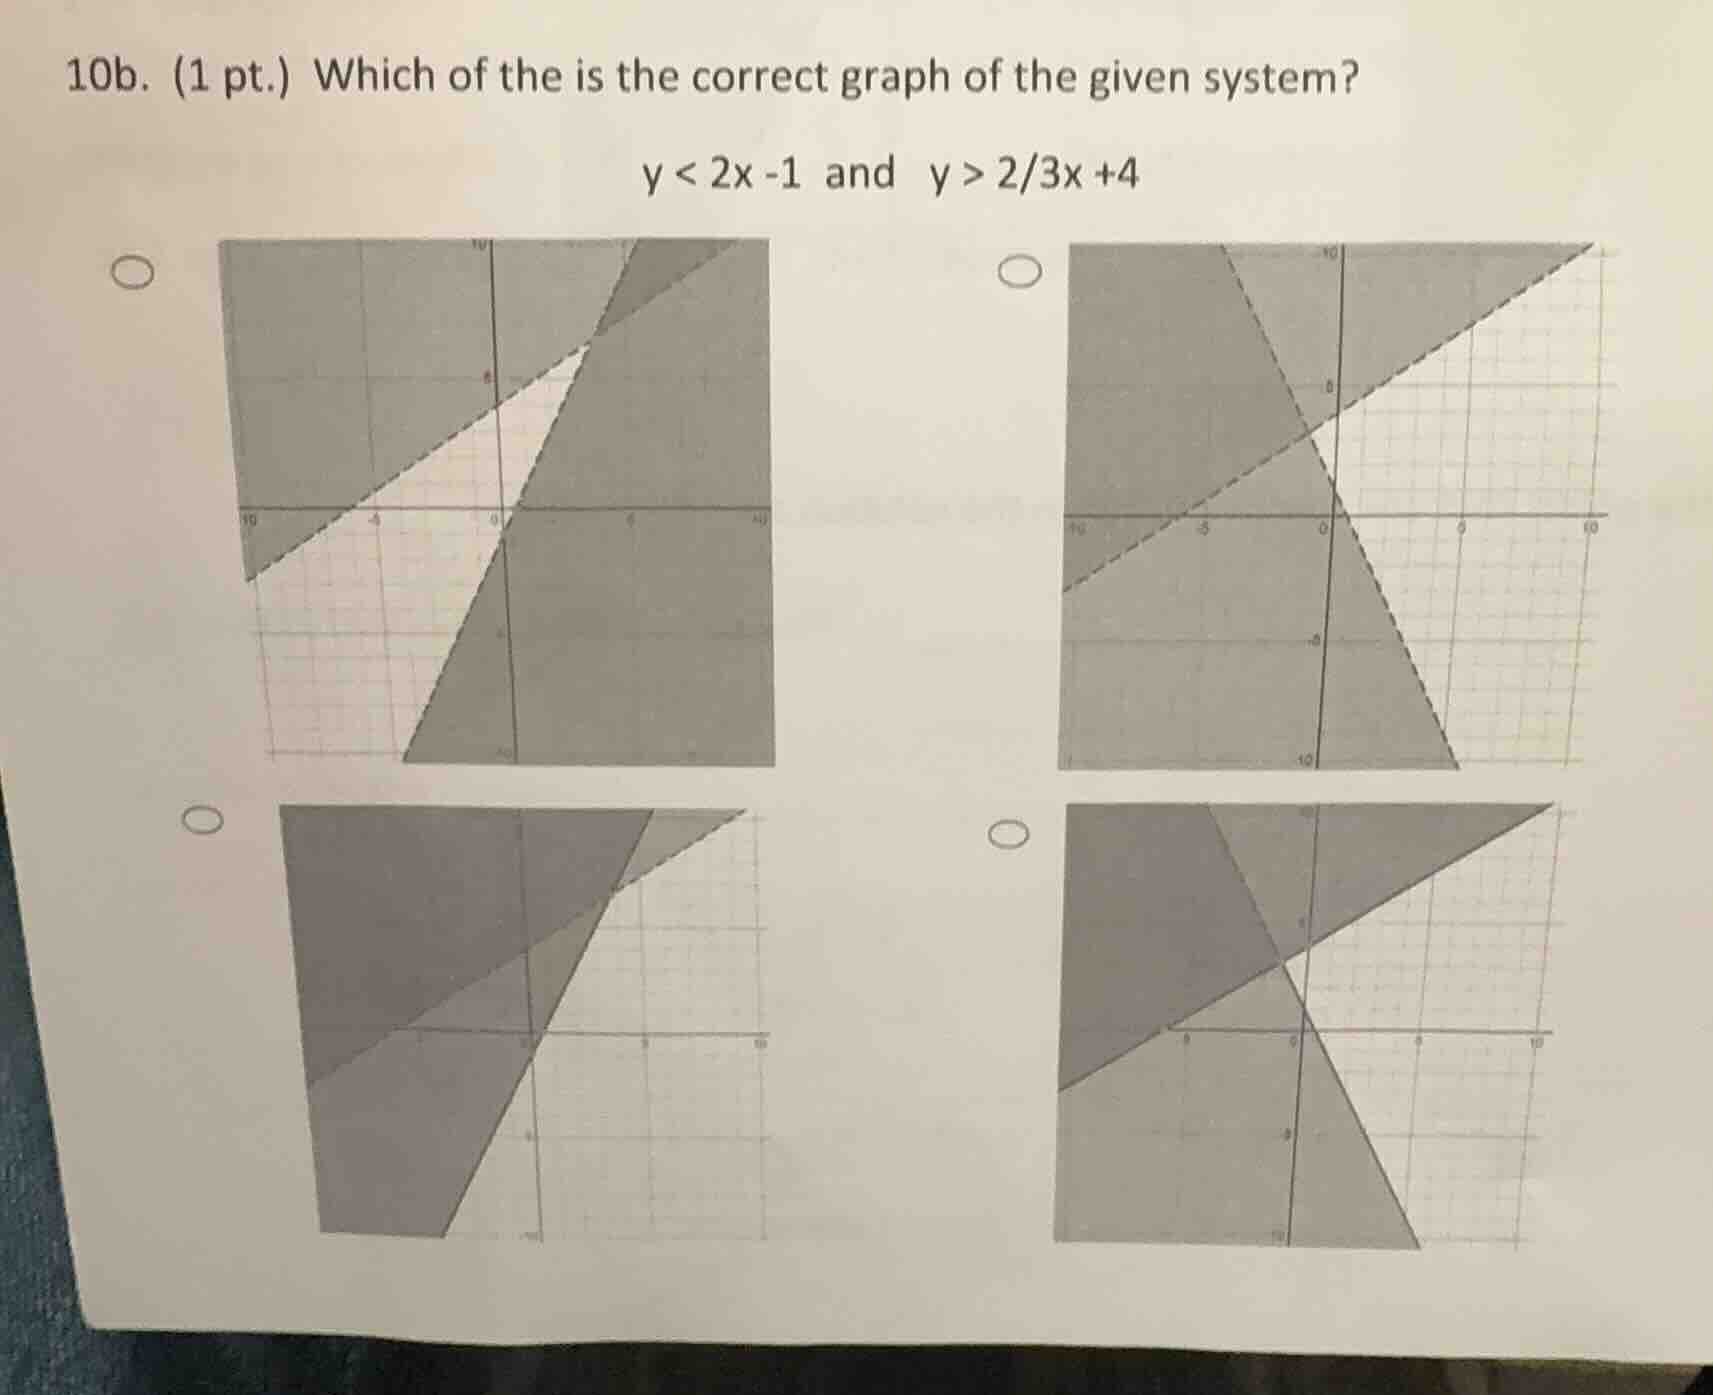
10b. (1 pt.) which of the is the correct graph of the given system?
$y < 2x -1$ and $y > \frac{2}{3}x +4$
Step1: Identify line styles
Both inequalities use $<$ and $>$, so both lines $y=2x-1$ and $y=\frac{2}{3}x+4$ are dashed.
Step2: Test shading for $y<2x-1$
Pick a test point, e.g., $(0,0)$: $0 < 2(0)-1$ → $0 < -1$ is false. Shade the region below $y=2x-1$.
Step3: Test shading for $y>\frac{2}{3}x+4$
Use $(0,0)$: $0 > \frac{2}{3}(0)+4$ → $0 > 4$ is false. Shade the region above $y=\frac{2}{3}x+4$.
Step4: Find overlapping region
The solution is the intersection of the two shaded regions, which is the small area bounded above by $y=\frac{2}{3}x+4$ and below by $y=2x-1$, with both lines dashed. This matches the top-left graph.

Snap & solve any problem in the app
Get step-by-step solutions on Sovi AI
Photo-based solutions with guided steps
Explore more problems and detailed explanations
The correct graph is the top-left option (the graph with a small white triangular region bounded by two dashed lines, with shading outside this triangle in the upper and lower areas).