QUESTION IMAGE
Question
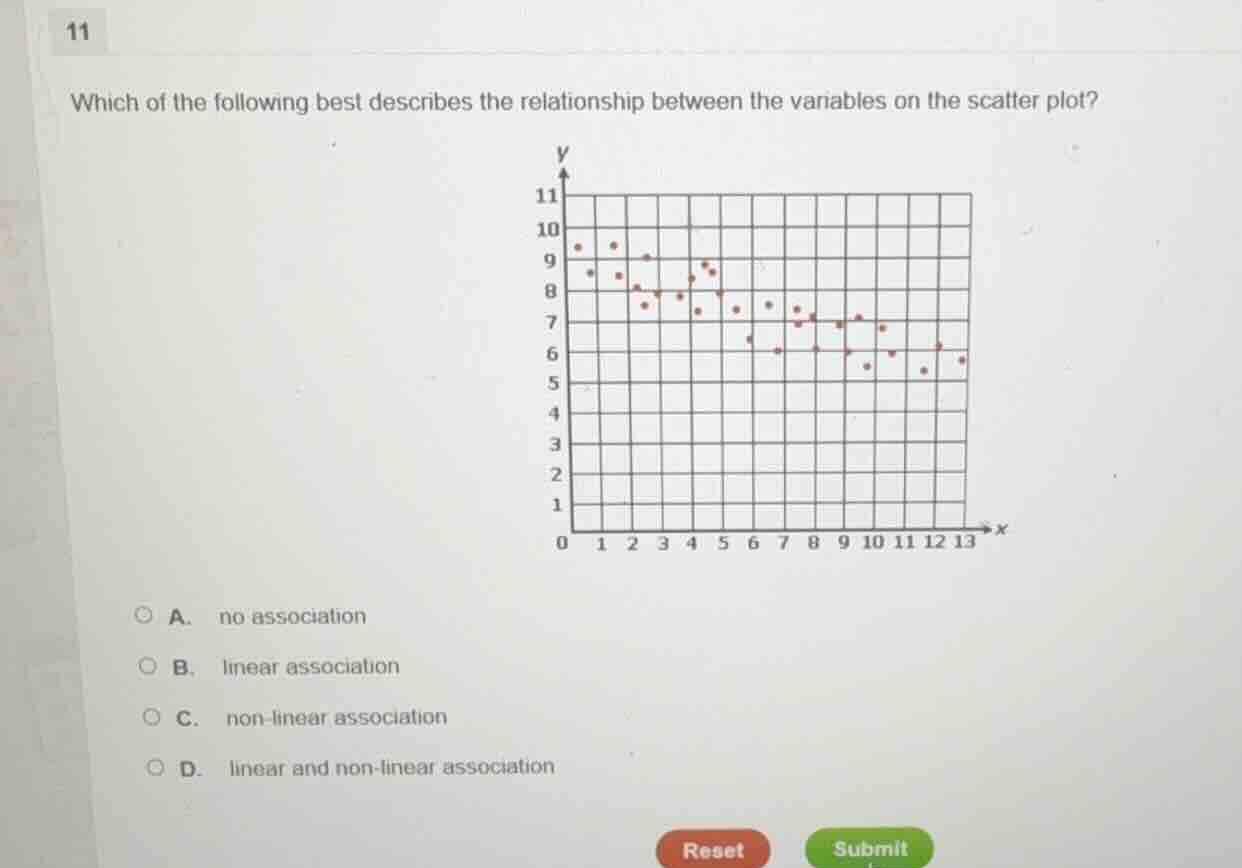
11
which of the following best describes the relationship between the variables on the scatter plot?
a. no association
b. linear association
c. non - linear association
d. linear and non - linear association
Brief Explanations
The scatter plot shows a clear downward trend where as x increases, y decreases, but the points follow a curved (not straight) pattern. This fits a non-linear association, as a linear association would follow a straight line, and there is a clear relationship so it is not no association.

Snap & solve any problem in the app
Get step-by-step solutions on Sovi AI
Photo-based solutions with guided steps
Explore more problems and detailed explanations
C. non-linear association