QUESTION IMAGE
Question
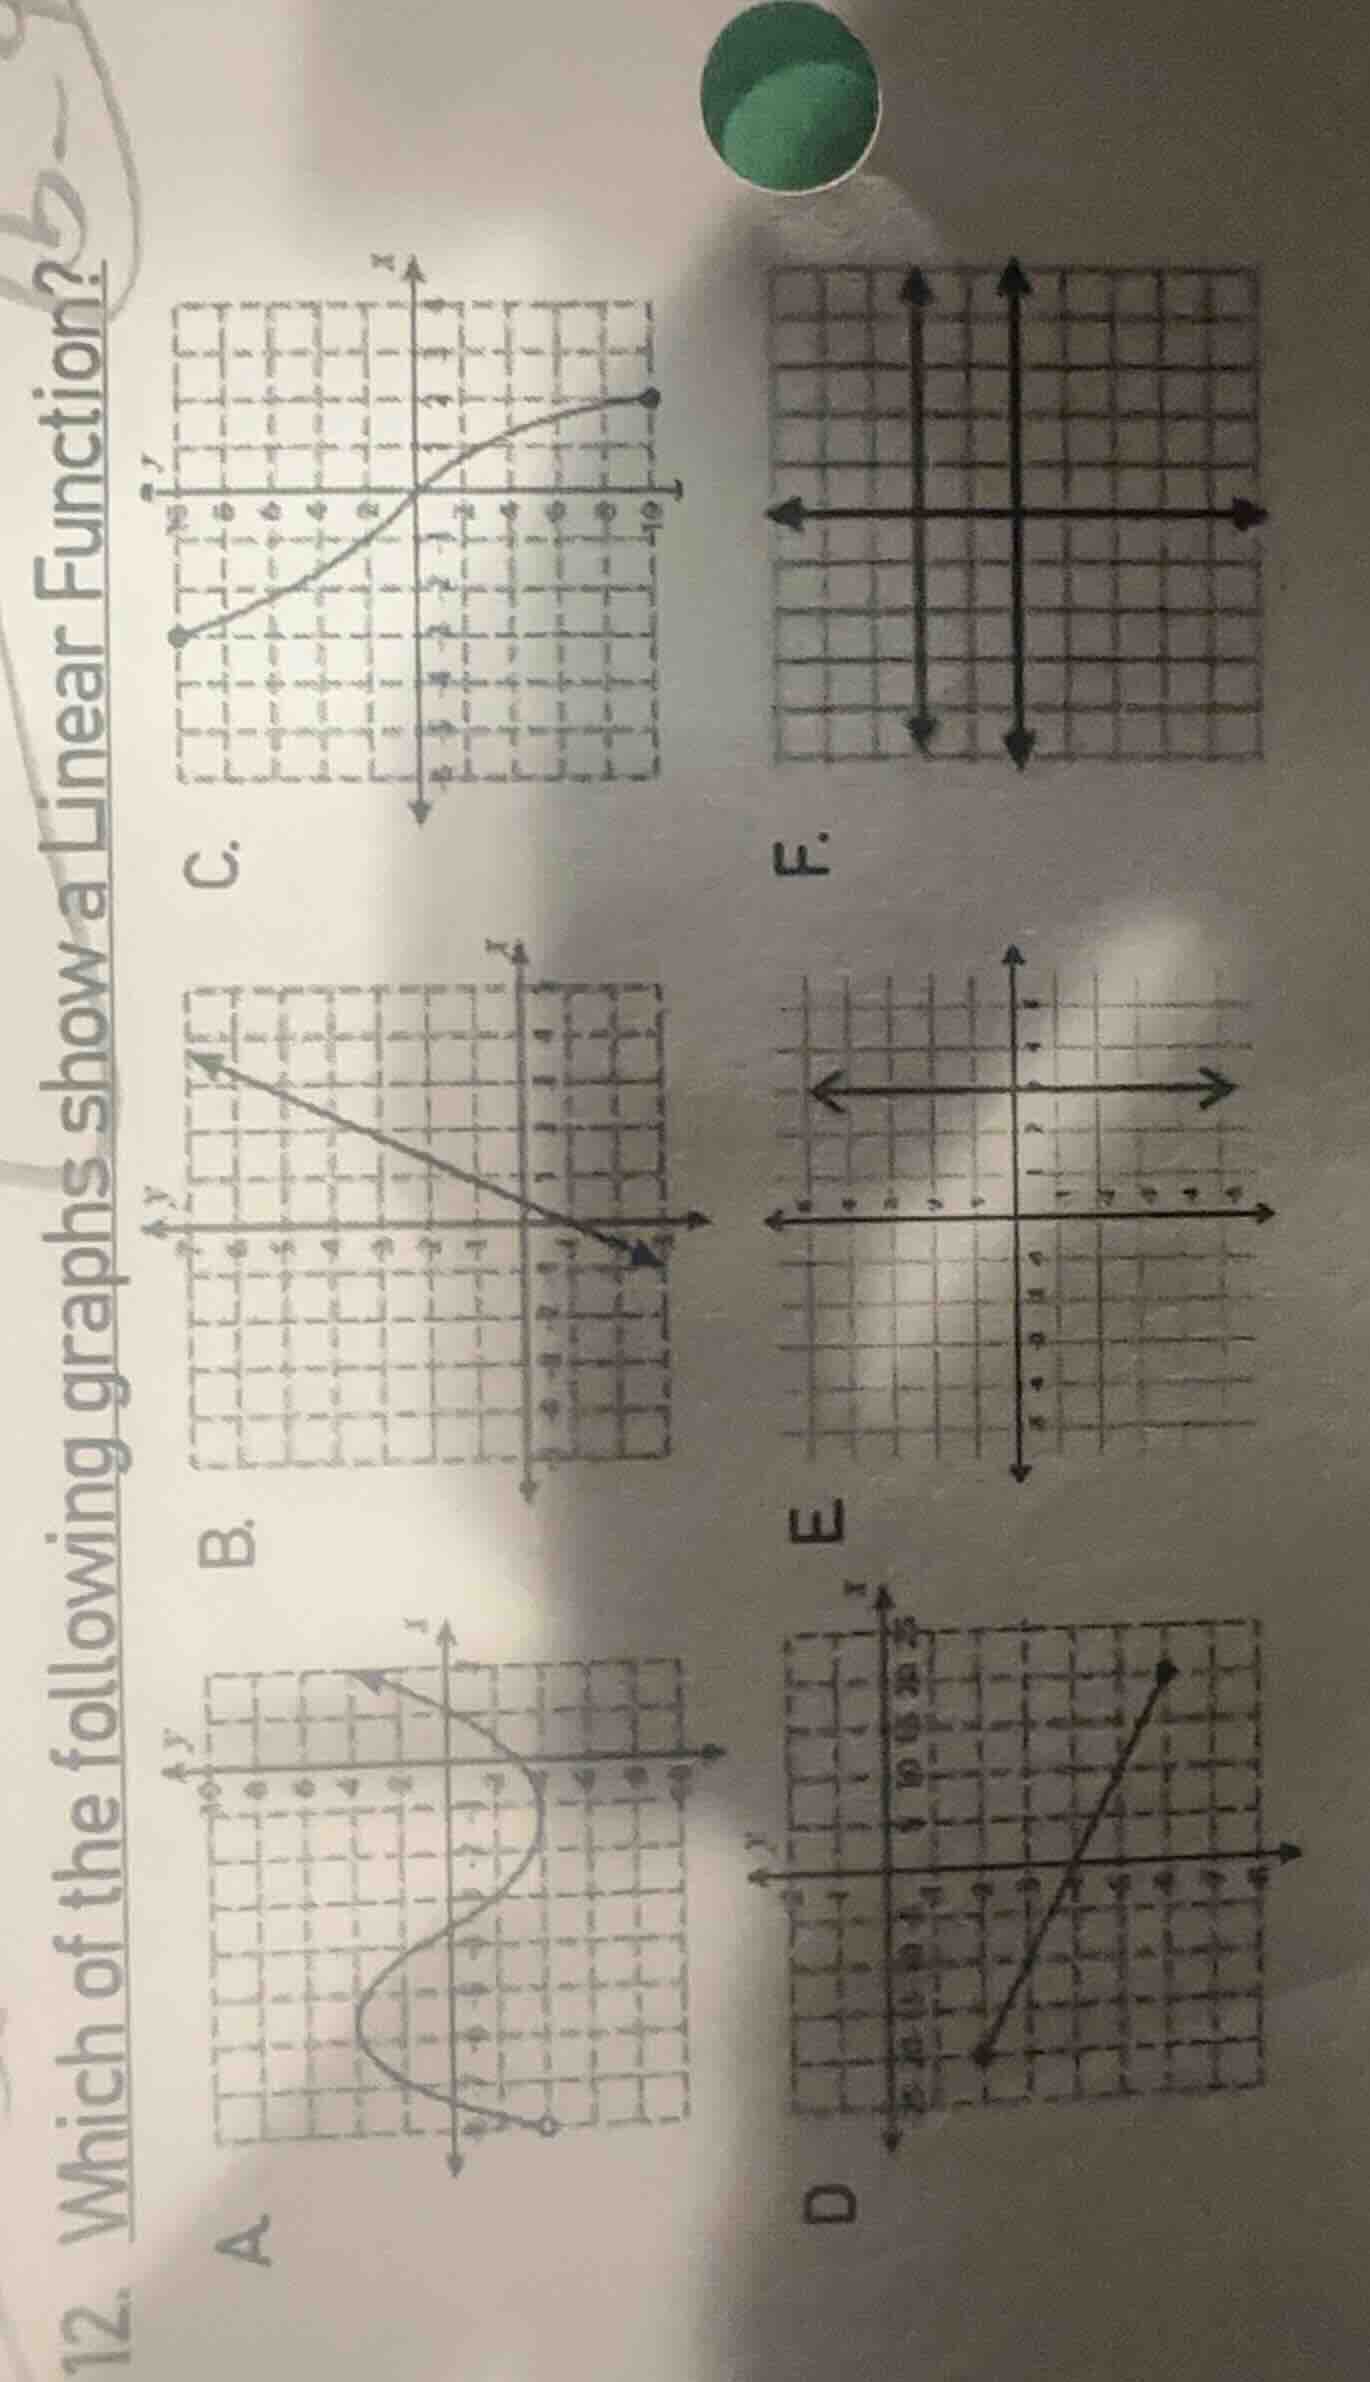
- which of the following graphs show a linear function?
Step1: Recall linear function definition
A linear function graphs as a straight line, follows $y=mx+b$, where $m$ (slope) is constant.
Step2: Analyze each graph
- A: Curved line (non-constant slope, not linear)
- B: Straight line (constant slope, linear)
- C: Curved line (non-constant slope, not linear)
- D: Straight line (constant slope, linear)
- E: Straight horizontal line (slope $m=0$, fits $y=b$, linear)
- F: Fails vertical line test (not a function at all)

Snap & solve any problem in the app
Get step-by-step solutions on Sovi AI
Photo-based solutions with guided steps
Explore more problems and detailed explanations
B. <The straight diagonal graph>, D. <The straight diagonal graph with large grid>, E. <The straight horizontal graph>