QUESTION IMAGE
Question
13
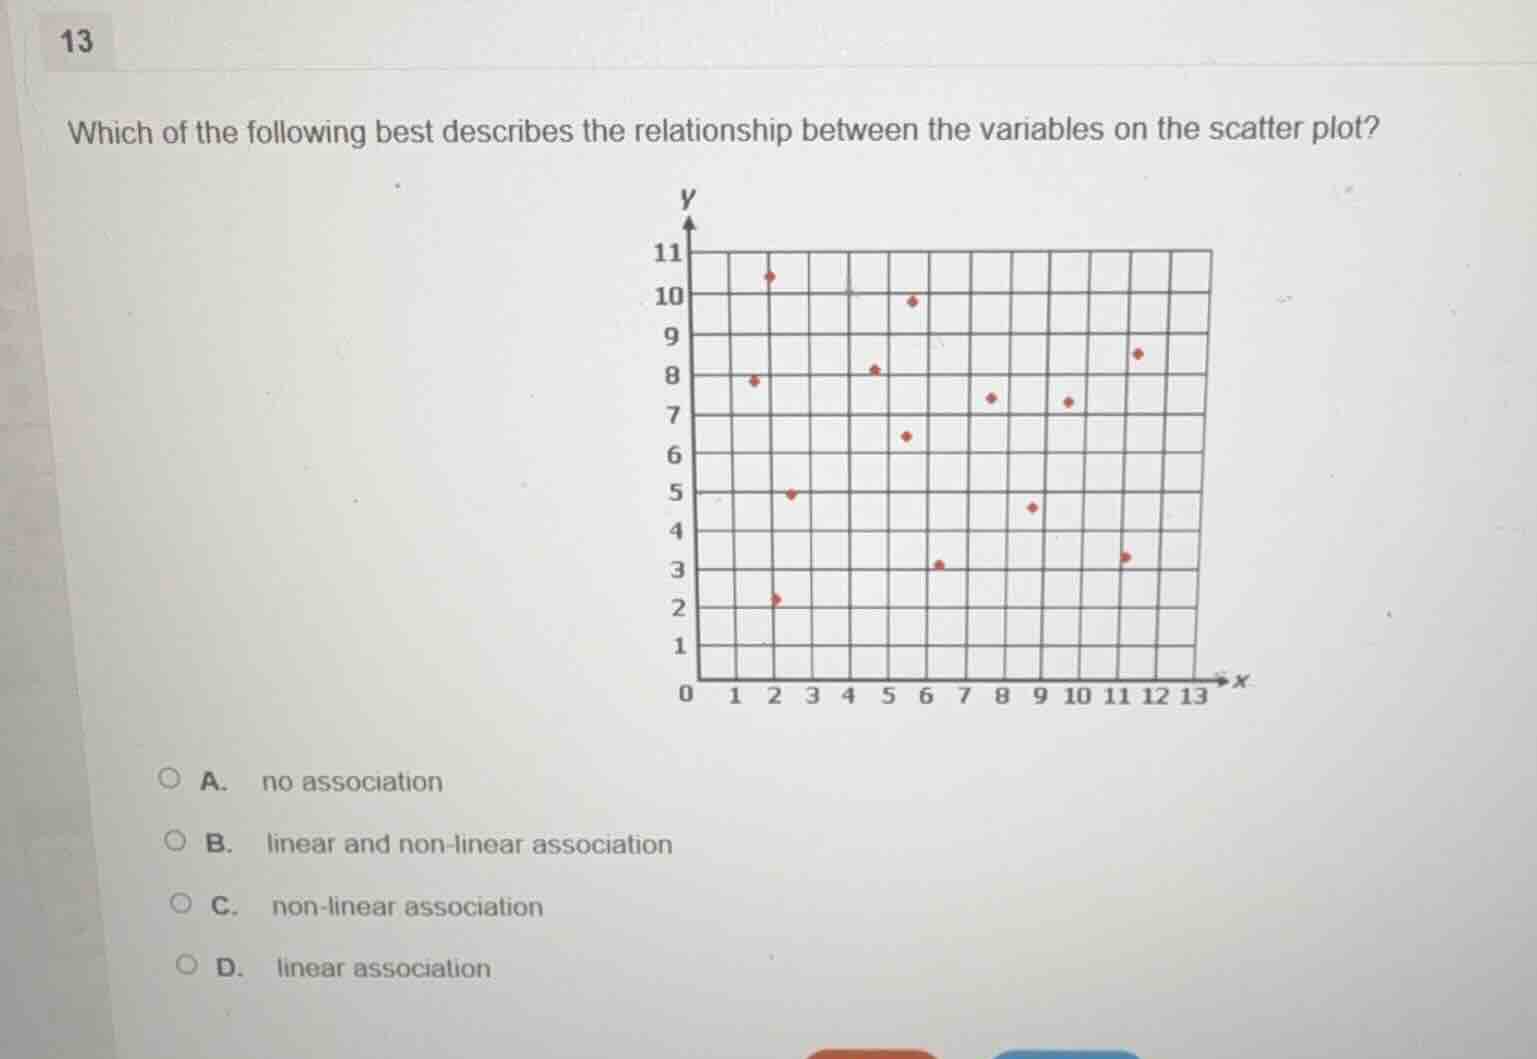
which of the following best describes the relationship between the variables on the scatter plot?
a. no association
b. linear and non - linear association
c. non - linear association
d. linear association
The scatter plot shows points that do not follow a straight-line pattern, nor do they cluster in a way that suggests a consistent linear trend. Instead, the points form a curved, non-straight pattern, indicating a non-linear relationship. There is a clear association, so option A is incorrect. A relationship cannot be both linear and non-linear at once, so option B is invalid. The pattern does not fit a straight line, so option D is wrong.

Snap & solve any problem in the app
Get step-by-step solutions on Sovi AI
Photo-based solutions with guided steps
Explore more problems and detailed explanations
C. non-linear association