QUESTION IMAGE
Question
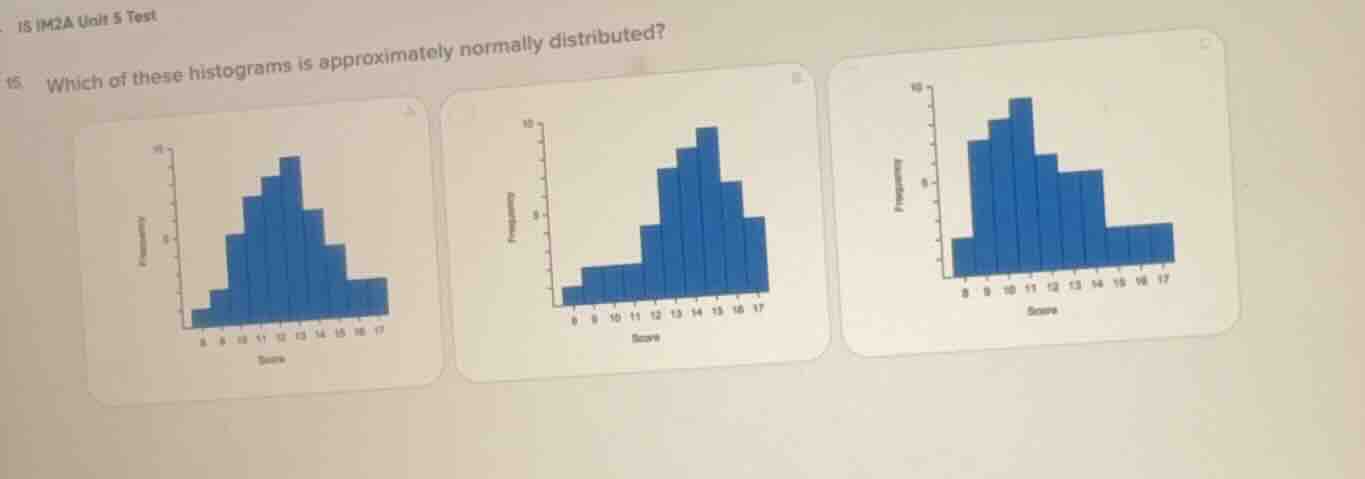
15 im2a unit 5 test
- which of these histograms is approximately normally distributed?
Brief Explanations
A normal distribution's histogram is symmetric and bell - shaped, with frequencies increasing to a peak and then decreasing symmetrically.
- For the first histogram: It has a single peak, and the frequencies on either side of the peak seem to be roughly symmetric.
- For the second histogram: The left - hand side (lower scores) has a different pattern of frequency increase compared to the right - hand side (higher scores), and it is not symmetric around a central peak.
- For the third histogram: The distribution of frequencies on either side of the peak is not symmetric; the right - hand side has a more extended tail - like structure compared to the left.
So the first histogram (let's assume it's option A if we consider the three as A, B, C) shows a shape that is approximately bell - shaped and symmetric, which is characteristic of a normal distribution.

Snap & solve any problem in the app
Get step-by-step solutions on Sovi AI
Photo-based solutions with guided steps
Explore more problems and detailed explanations
A (assuming the first histogram is option A, with the symmetric, bell - shaped distribution of scores)