QUESTION IMAGE
Question
15
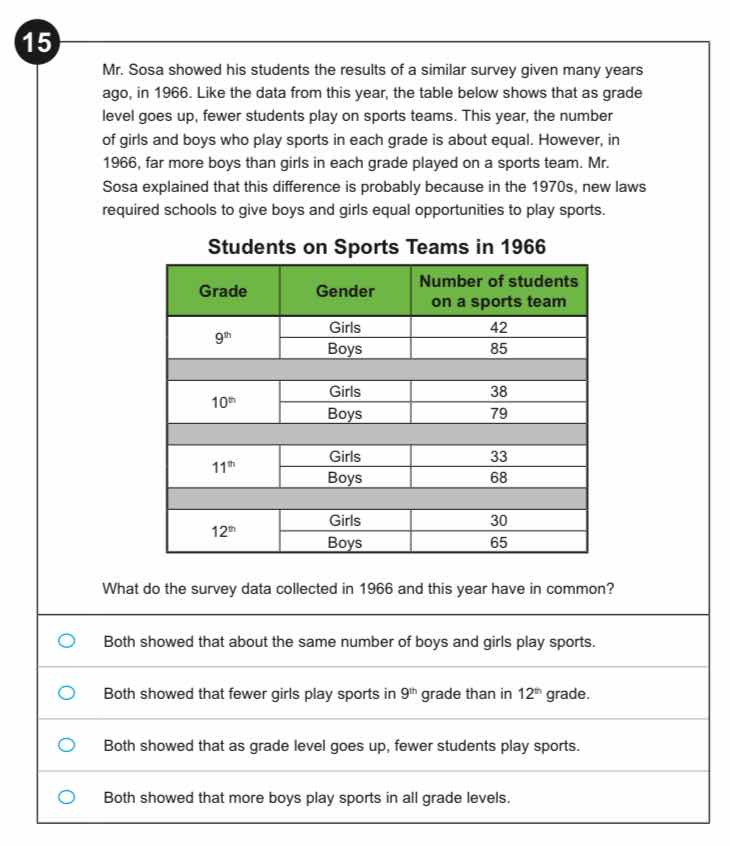
mr. sosa showed his students the results of a similar survey given many years ago, in 1966. like the data from this year, the table below shows that as grade level goes up, fewer students play on sports teams. this year, the number of girls and boys who play sports in each grade is about equal. however, in 1966, far more boys than girls in each grade played on a sports team. mr. sosa explained that this difference is probably because in the 1970s, new laws required schools to give boys and girls equal opportunities to play sports.
students on sports teams in 1966
what do the survey data collected in 1966 and this year have in common?
both showed that about the same number of boys and girls play sports.
both showed that fewer girls play sports in 9ⁿᵗʰ grade than in 12ᵗʰ grade.
both showed that as grade level goes up, fewer students play sports.
both showed that more boys play sports in all grade levels.
First, analyze the 1966 data: as grade increases from 9th to 12th, the total number of students (girls + boys) on sports teams decreases (127 → 117 → 101 → 95). The question states this year's data also has the pattern that as grade level goes up, fewer students play on sports teams. Now evaluate each option:
- 1966 data has far more boys than girls playing sports, so the first option is incorrect.
- In 1966, 9th grade girls (42) are more than 12th grade girls (30), so the second option is incorrect.
- Both 1966 and this year's data share the trend that higher grades have fewer students on sports teams, so this option is correct.
- This year's data has about equal numbers of boys and girls playing sports, so the fourth option is incorrect.

Snap & solve any problem in the app
Get step-by-step solutions on Sovi AI
Photo-based solutions with guided steps
Explore more problems and detailed explanations
Both showed that as grade level goes up, fewer students play sports.