QUESTION IMAGE
Question
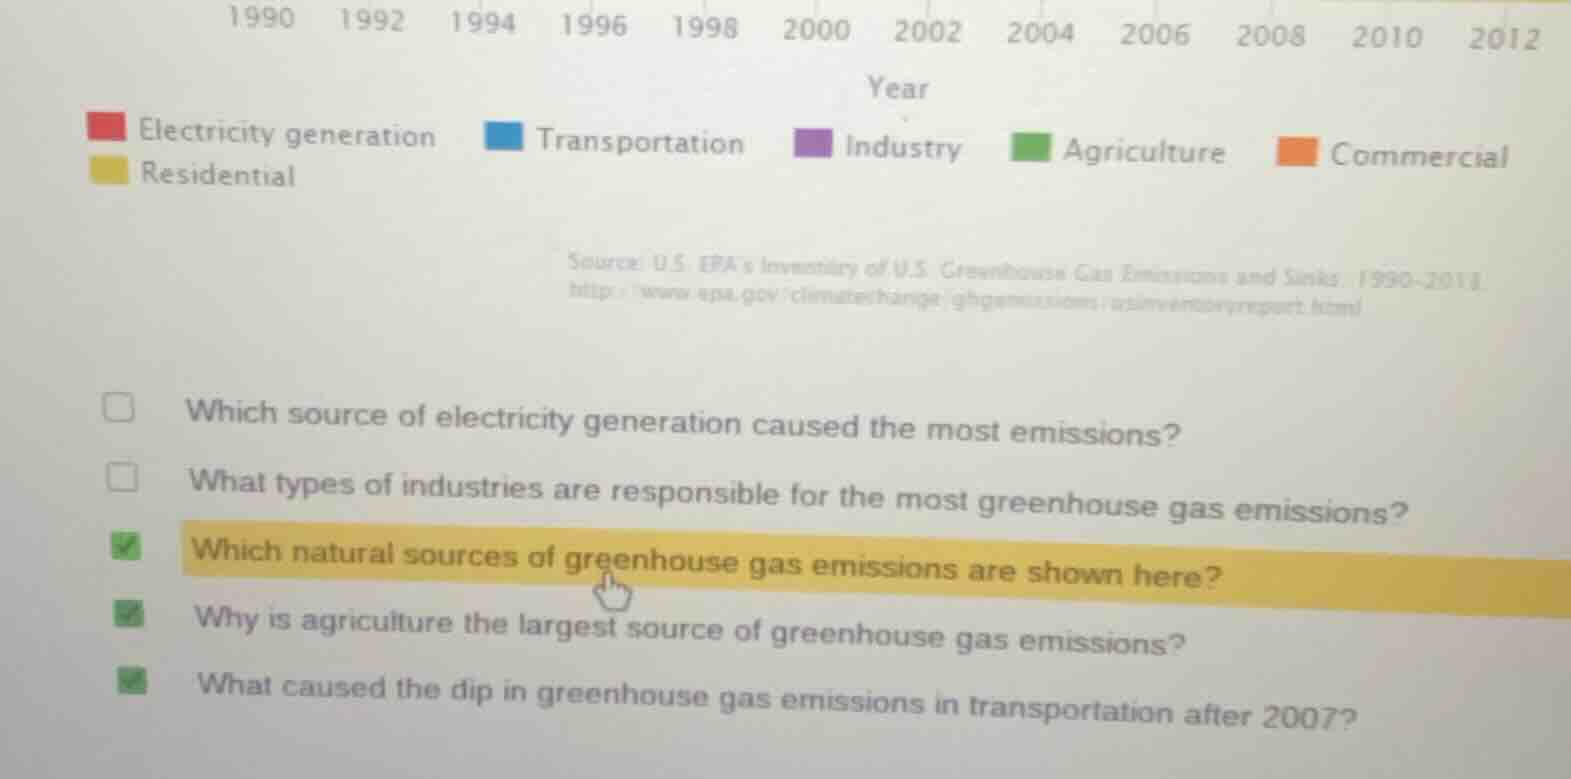
1990 1992 1994 1996 1998 2000 2002 2004 2006 2008 2010 2012
year
electricity generation transportation industry agriculture commercial
residential
source: u.s. epas inventory of u.s. greenhouse gas emissions and sinks: 1990-2011.
http://www.epa.gov/climatechange/ghgemissions/usinventoryreport.html
which source of electricity generation caused the most emissions?
what types of industries are responsible for the most greenhouse gas emissions?
which natural sources of greenhouse gas emissions are shown here?
why is agriculture the largest source of greenhouse gas emissions?
what caused the dip in greenhouse gas emissions in transportation after 2007?
To answer the question "Which natural sources of greenhouse gas emissions are shown here?", we analyze the legend and the context:
The legend (colors) lists sectors: Electricity generation, Transportation, Industry, Agriculture, Commercial, Residential. All these are human - related (anthropogenic) sectors (e.g., industry, transportation, agriculture are human activities). There are no labels for natural sources (like forests, oceans, volcanic activity, etc.) in the legend or the graph’s context. So, the graph does not display any natural sources of greenhouse gas emissions.

Snap & solve any problem in the app
Get step-by-step solutions on Sovi AI
Photo-based solutions with guided steps
Explore more problems and detailed explanations
The graph (from the U.S. EPA’s inventory) shows anthropogenic (human - related) sectors (Electricity generation, Transportation, Industry, Agriculture, Commercial, Residential) for greenhouse gas emissions. No natural sources (e.g., volcanic activity, natural decay, forest emissions) are shown here.