QUESTION IMAGE
Question
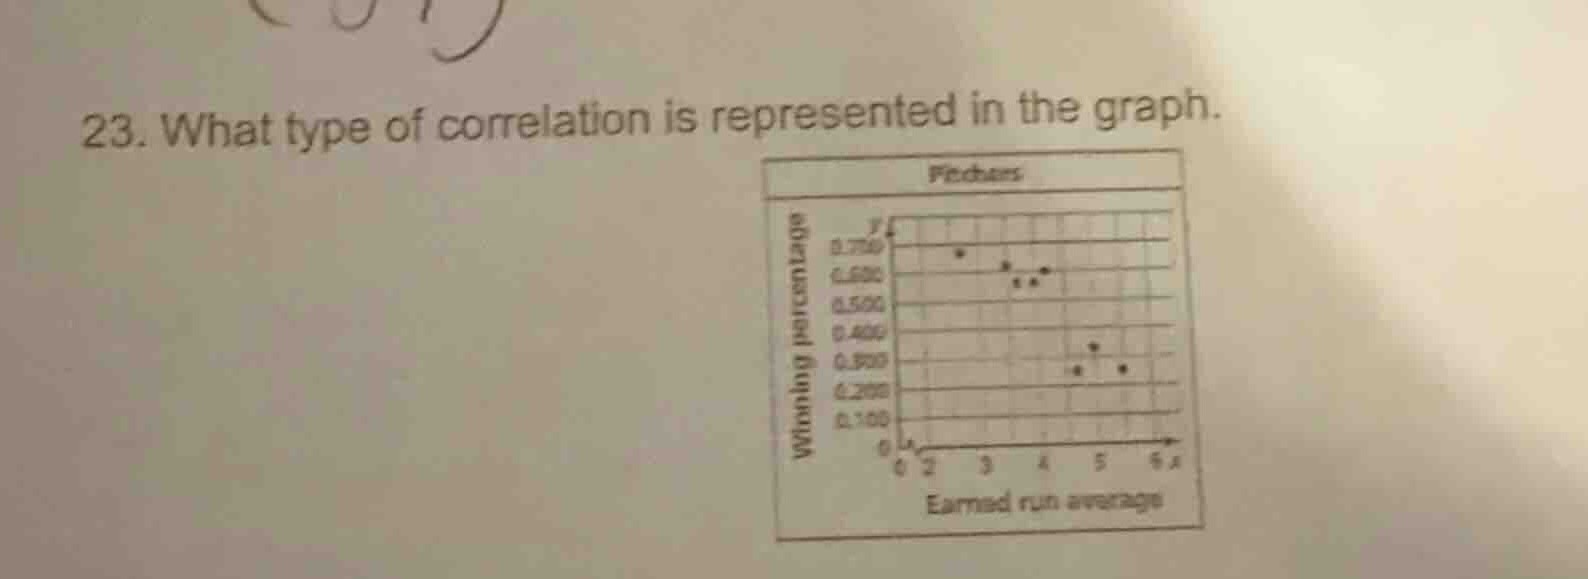
- what type of correlation is represented in the graph.
Brief Explanations
To determine the correlation, we analyze the scatter plot. As the x - variable (Earned run average) increases, the y - variable (Winning percentage) generally decreases. This indicates a negative correlation, where an increase in one variable is associated with a decrease in the other.

Snap & solve any problem in the app
Get step-by-step solutions on Sovi AI
Photo-based solutions with guided steps
Explore more problems and detailed explanations
Negative correlation