QUESTION IMAGE
Question
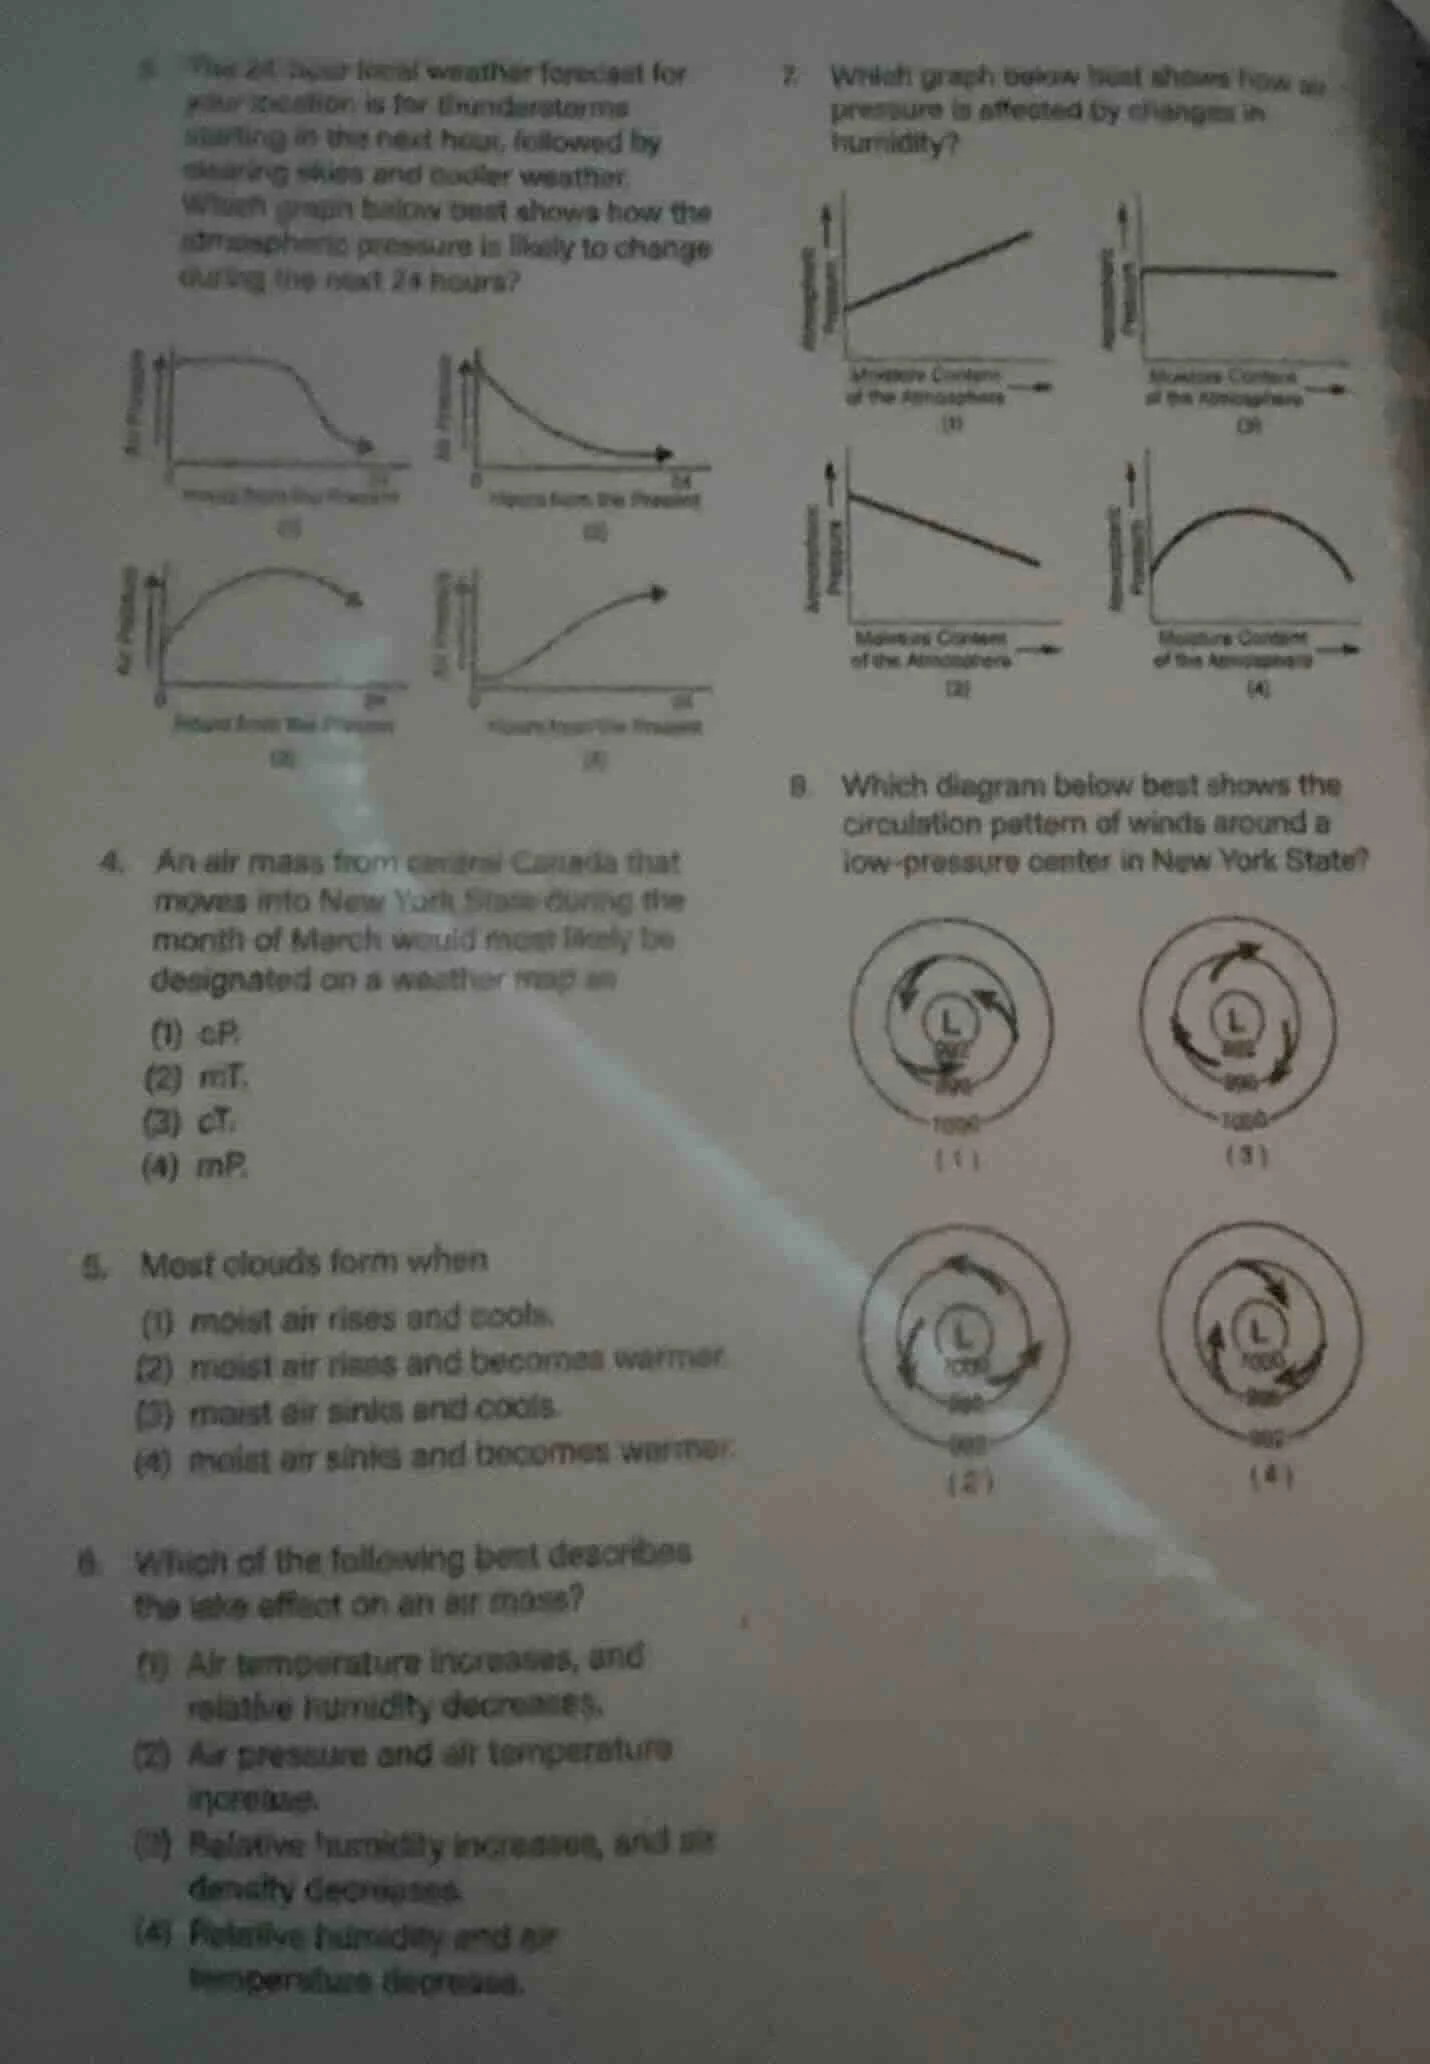
- the 24-hour local weather forecast for your location is for thunderstorms starting in the next hour, followed by clearing skies and cooler weather. which graph below best shows how the atmospheric pressure is likely to change during the next 24 hours?4. an air mass from central canada that moves into new york state during the month of march would most likely be designated on a weather map as(1) cp(2) mt(3) ct(4) mp5. most clouds form when(1) moist air rises and cools.(2) moist air rises and becomes warmer.(3) moist air sinks and cools.(4) moist air sinks and becomes warmer.6. which of the following best describes the lake effect on an air mass?(1) air temperature increases, and relative humidity decreases.(2) air pressure and air temperature increase.(3) relative humidity increases, and air density decreases.(4) relative humidity and air temperature decrease.7. which graph below best shows how air pressure is affected by changes in humidity?8. which diagram below best shows the circulation pattern of winds around a low-pressure center in new york state?
Question 3:
Thunderstorms are linked to low pressure; after storms, clearing/cooler weather brings rising high pressure. The first graph shows initial steady pressure, then a drop (for storms), followed by a rise.
Question 4:
Central Canada is a continental (c) polar (P) source region: cold, dry air mass.
Question 5:
Clouds form when moist air rises, expands, and cools to its dew point, causing water vapor to condense.
Question 6:
The lake effect occurs when dry air passes over a lake, picking up moisture: this increases relative humidity, and added moisture lowers air density.
Question 7:
As atmospheric humidity (moisture content) increases, air pressure decreases because water vapor is less dense than dry air.
Question 8:
In the Northern Hemisphere (New York State), winds around a low-pressure center rotate counterclockwise and inward, with isobars increasing outward.

Snap & solve any problem in the app
Get step-by-step solutions on Sovi AI
Photo-based solutions with guided steps
Explore more problems and detailed explanations
- (1) The top-left graph (steady pressure → drop → rise)
- (1) cP
- (1) moist air rises and cools.
- (3) Relative humidity increases, and air density decreases.
- (2) The bottom-left graph (pressure decreases as moisture increases)
- (1) The top-left diagram (counterclockwise inward circulation around low pressure)