QUESTION IMAGE
Question
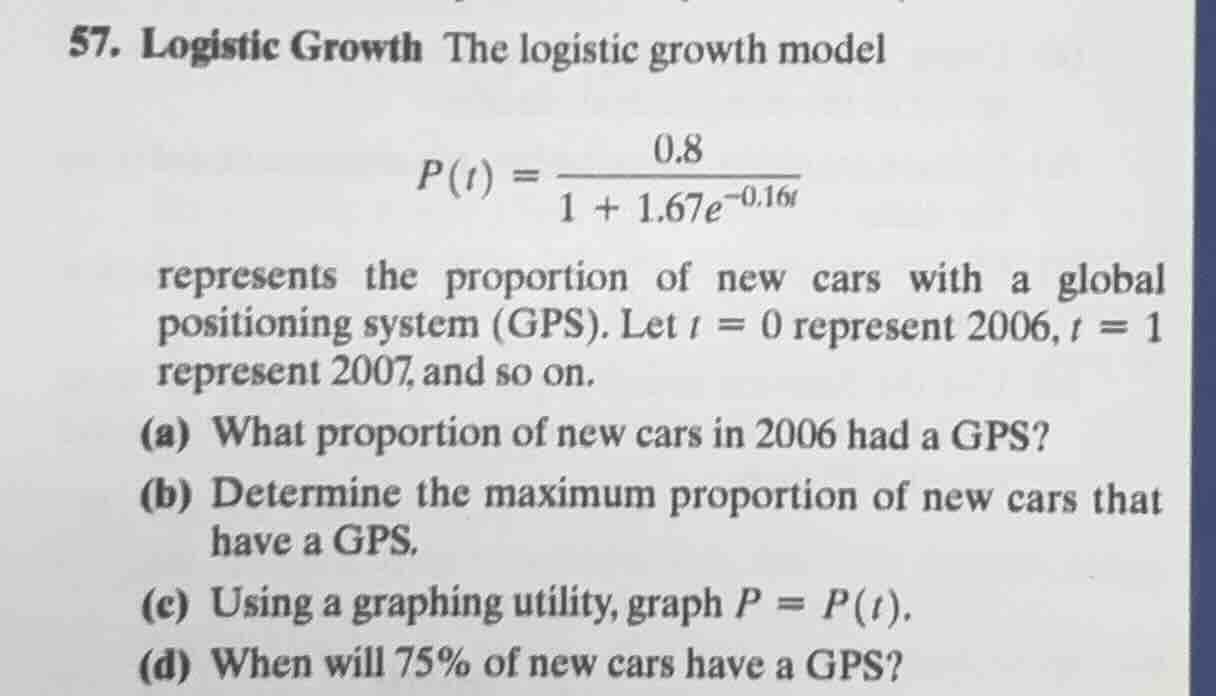
- logistic growth the logistic growth model
$p(t) = \frac{0.8}{1 + 1.67e^{-0.16t}}$
represents the proportion of new cars with a global positioning system (gps). let $t = 0$ represent 2006, $t = 1$ represent 2007, and so on.
(a) what proportion of new cars in 2006 had a gps?
(b) determine the maximum proportion of new cars that have a gps.
(c) using a graphing utility, graph $p = p(t)$.
(d) when will 75% of new cars have a gps?
Part (a)
Step1: Identify \( t \) for 2006
Since \( t = 0 \) represents 2006, we substitute \( t = 0 \) into the logistic growth model \( P(t)=\frac{0.8}{1 + 1.67e^{-0.16t}} \).
Step2: Substitute \( t = 0 \)
When \( t = 0 \), \( e^{-0.16\times0}=e^{0} = 1 \). So \( P(0)=\frac{0.8}{1+1.67\times1}=\frac{0.8}{2.67}\approx0.2996 \).
Step1: Recall logistic growth limit
For a logistic growth model \( P(t)=\frac{L}{1 + be^{-kt}} \), the maximum proportion (carrying capacity) is \( L \).
Step2: Identify \( L \) in the given model
In the model \( P(t)=\frac{0.8}{1 + 1.67e^{-0.16t}} \), we can see that \( L = 0.8 \).
To graph \( P(t)=\frac{0.8}{1 + 1.67e^{-0.16t}} \):
- Domain and Range: The domain is \( t\geq0 \) (since \( t \) represents years starting from 2006). The range is \( 0 < P(t)<0.8 \) (from logistic growth properties, it approaches 0.8 as \( t\to\infty \) and starts at \( P(0)\approx0.3 \)).
- Key Points:
- At \( t = 0 \), \( P(0)\approx0.3 \).
- As \( t\to\infty \), \( P(t)\to0.8 \).
- The function is increasing (since the exponent has a negative coefficient but the overall function's derivative for logistic growth is positive, indicating growth towards the carrying capacity).
- Using a Graphing Utility:
- Input the function \( y=\frac{0.8}{1 + 1.67e^{-0.16x}} \) (using \( x \) for \( t \)) into a graphing calculator or software like Desmos, GeoGebra, or TI - 84.
- Adjust the window settings: For \( x \) (t - axis), use a range like \( x:0\) to \( 30 \) (to see the approach to the carrying capacity). For \( y \) (P - axis), use \( y:0\) to \( 1 \) (since \( P(t) \) is a proportion).

Snap & solve any problem in the app
Get step-by-step solutions on Sovi AI
Photo-based solutions with guided steps
Explore more problems and detailed explanations
Approximately \( 0.30 \) (or \( 30\% \)) of new cars in 2006 had a GPS.