QUESTION IMAGE
Question
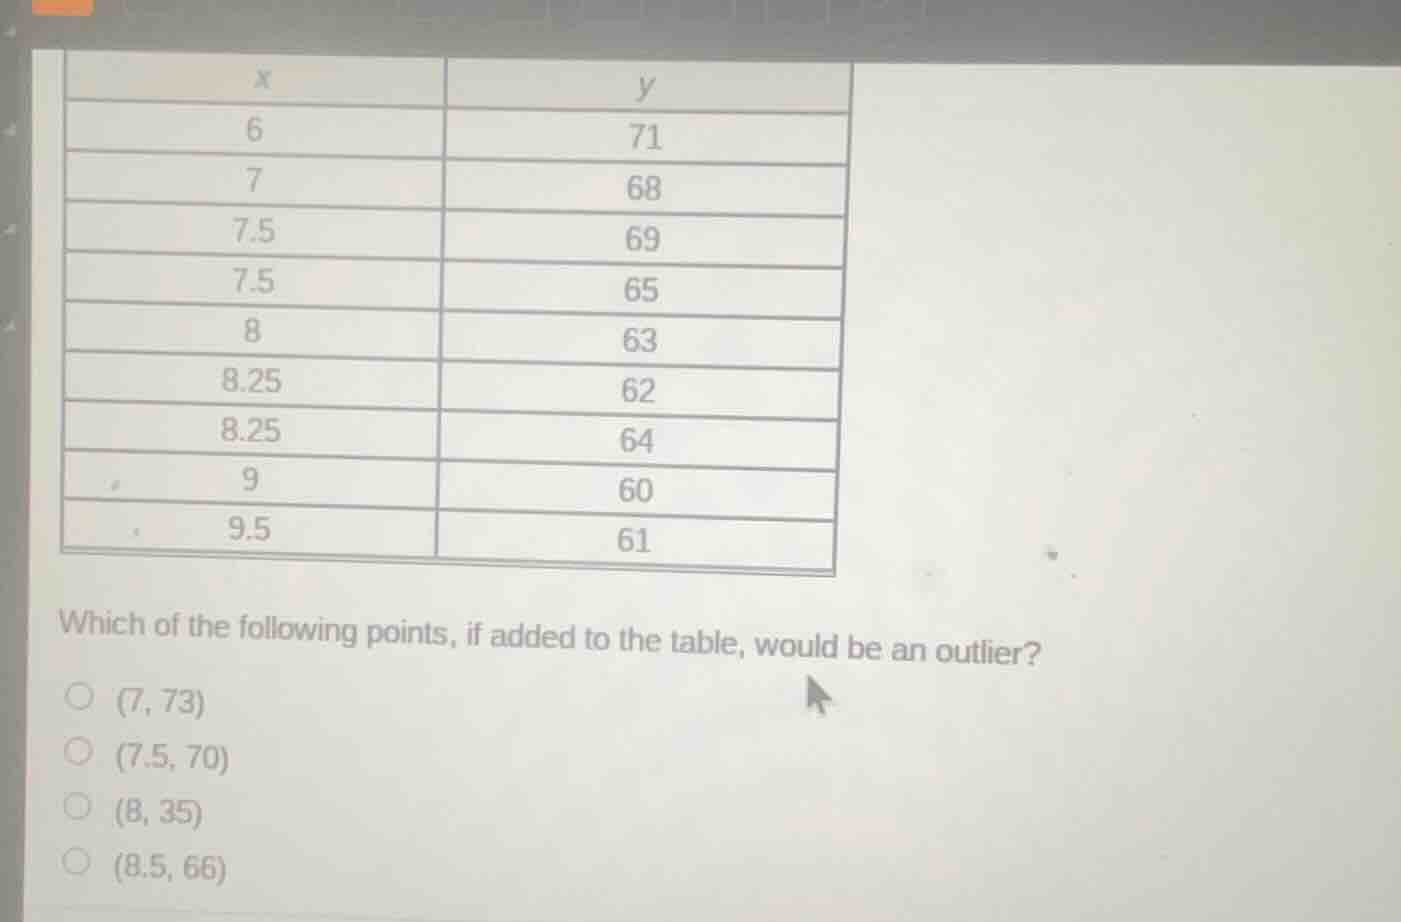
x | y
6 | 71
7 | 68
7.5 | 69
7.5 | 65
8 | 63
8.25 | 62
8.25 | 64
9 | 60
9.5 | 61
which of the following points, if added to the table, would be an outlier?
(7, 73)
(7.5, 70)
(8, 35)
(8.5, 66)
Step1: Analyze the trend of existing data
Looking at the table, as \( x \) increases (from 6 to 9.5), \( y \) generally decreases (from 71 to 61). The \( y \)-values are mostly in the range of 60 - 71.
Step2: Evaluate each option
- For \((7, 73)\): When \( x = 7 \), the original \( y \)-value is 68. 73 is a bit higher but still within a reasonable range around the general trend (since at \( x = 6 \), \( y = 71 \), so 73 at \( x = 7 \) is not too far off).
- For \((7.5, 70)\): At \( x = 7.5 \), original \( y \)-values are 69 and 65. 70 is close to 69, so it's within a reasonable range.
- For \((8, 35)\): When \( x = 8 \), the original \( y \)-value is 63. 35 is much lower than 63 and far from the general trend of \( y \)-values (which are mostly 60 - 71). This is a large deviation.
- For \((8.5, 66)\): The \( x \)-value 8.5 is between 8.25 and 9, and the \( y \)-value 66 is within the range of \( y \)-values (60 - 69) for that \( x \)-range, so it's reasonable.

Snap & solve any problem in the app
Get step-by-step solutions on Sovi AI
Photo-based solutions with guided steps
Explore more problems and detailed explanations
(8, 35)