QUESTION IMAGE
Question
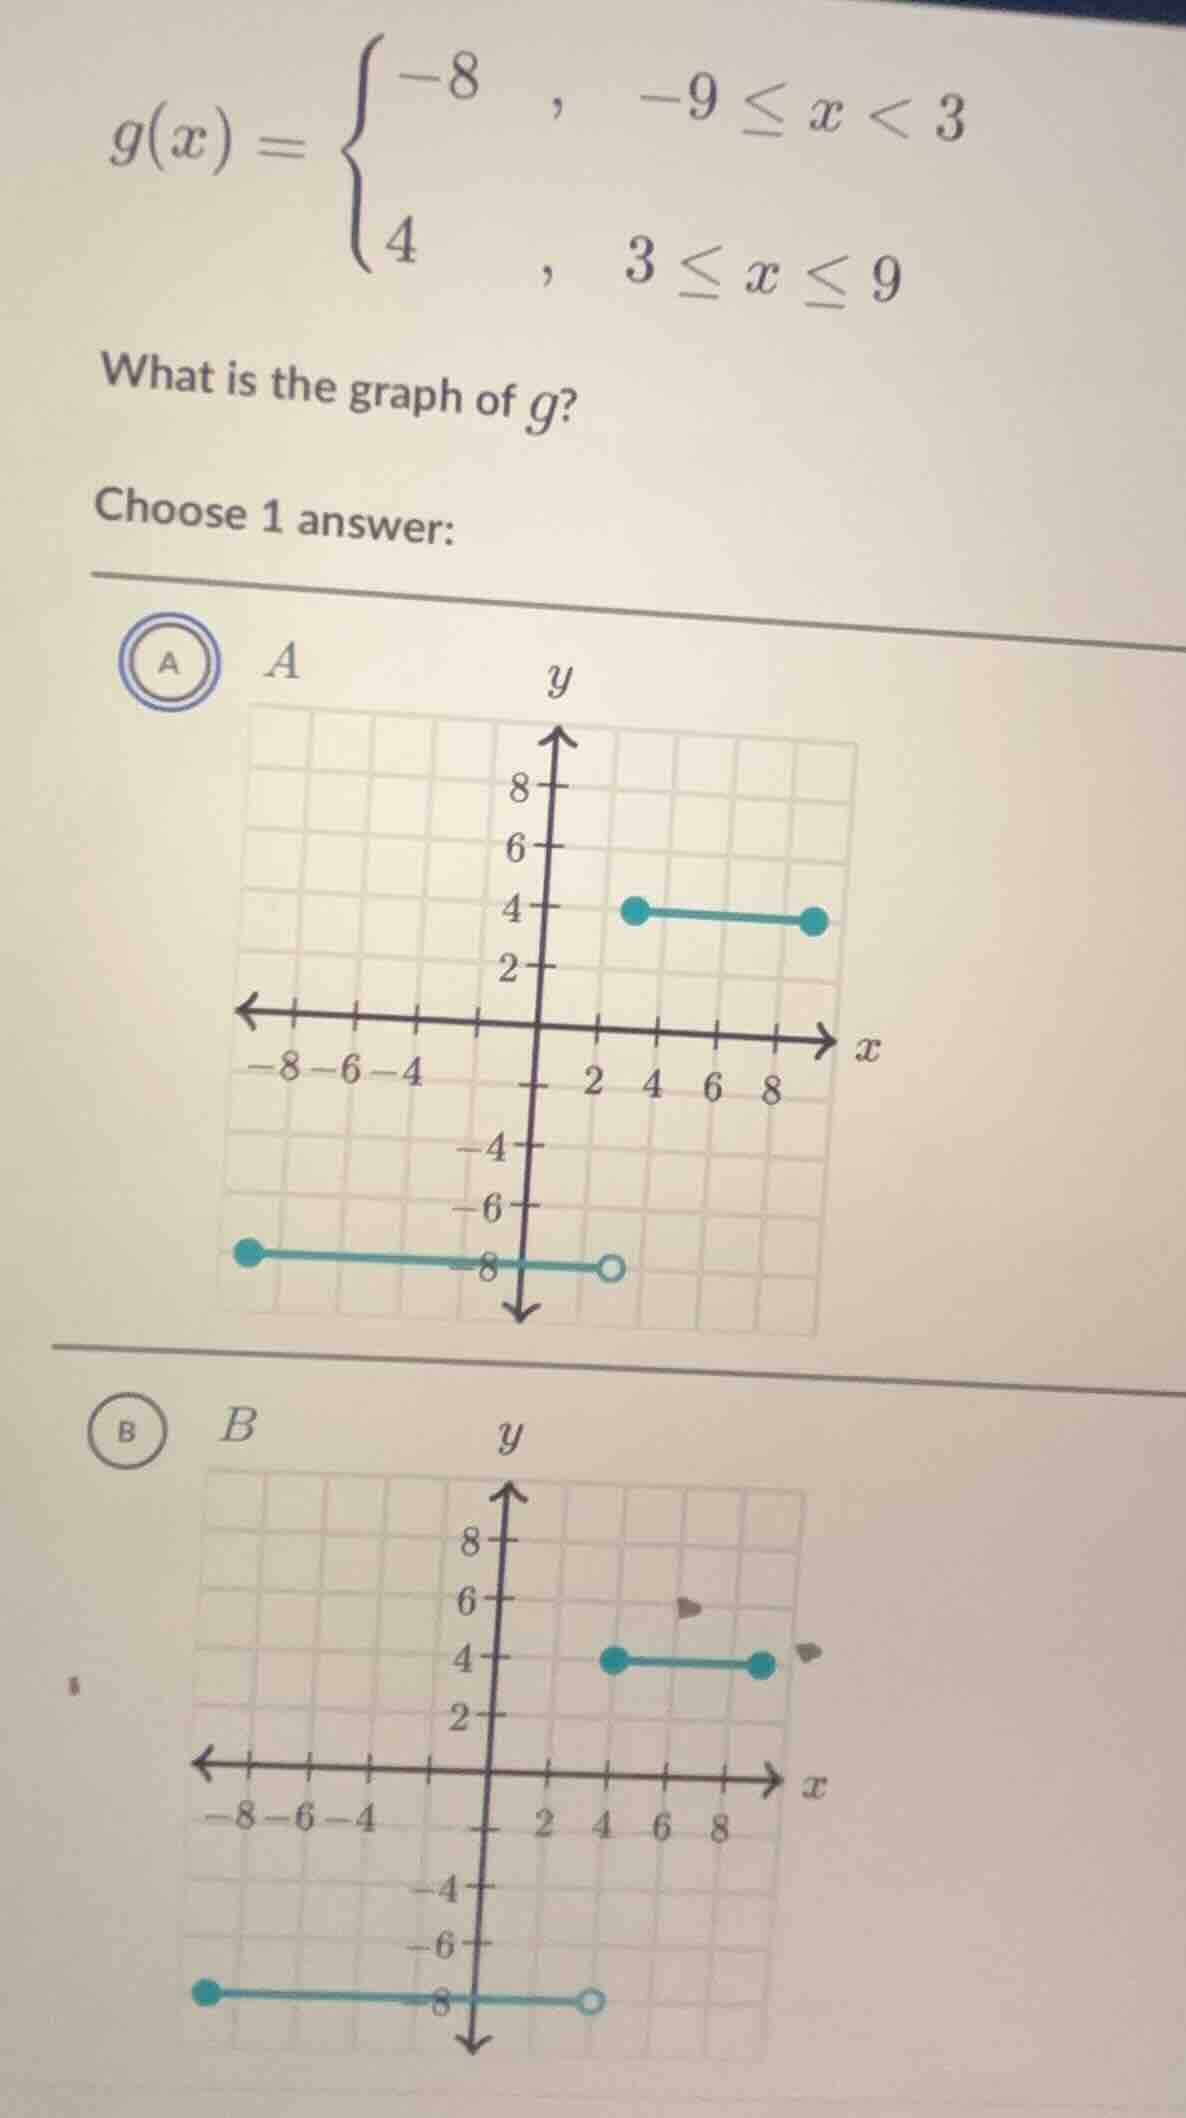
g(x) = \
what is the graph of g?
choose 1 answer:
a graph a
b graph b
Step1: Analyze first piece of function
For $-9 \leq x < 3$, $g(x)=-8$. This is a horizontal line at $y=-8$, with a closed dot at $x=-9$ (since $x=-9$ is included) and an open dot at $x=3$ (since $x=3$ is not included).
Step2: Analyze second piece of function
For $3 \leq x \leq 9$, $g(x)=4$. This is a horizontal line at $y=4$, with closed dots at both $x=3$ and $x=9$ (since both endpoints are included).
Step3: Match to the options
Option A has a horizontal line at $y=-8$ with closed dot at $x=-9$, open dot at $x=3$, and a horizontal line at $y=4$ with closed dots at $x=3$ and $x=9$, which matches our analysis.

Snap & solve any problem in the app
Get step-by-step solutions on Sovi AI
Photo-based solutions with guided steps
Explore more problems and detailed explanations
A. The graph with a horizontal line at $y=-8$ (closed dot at $x=-9$, open dot at $x=3$) and a horizontal line at $y=4$ (closed dots at $x=3$ and $x=9$)