QUESTION IMAGE
Question
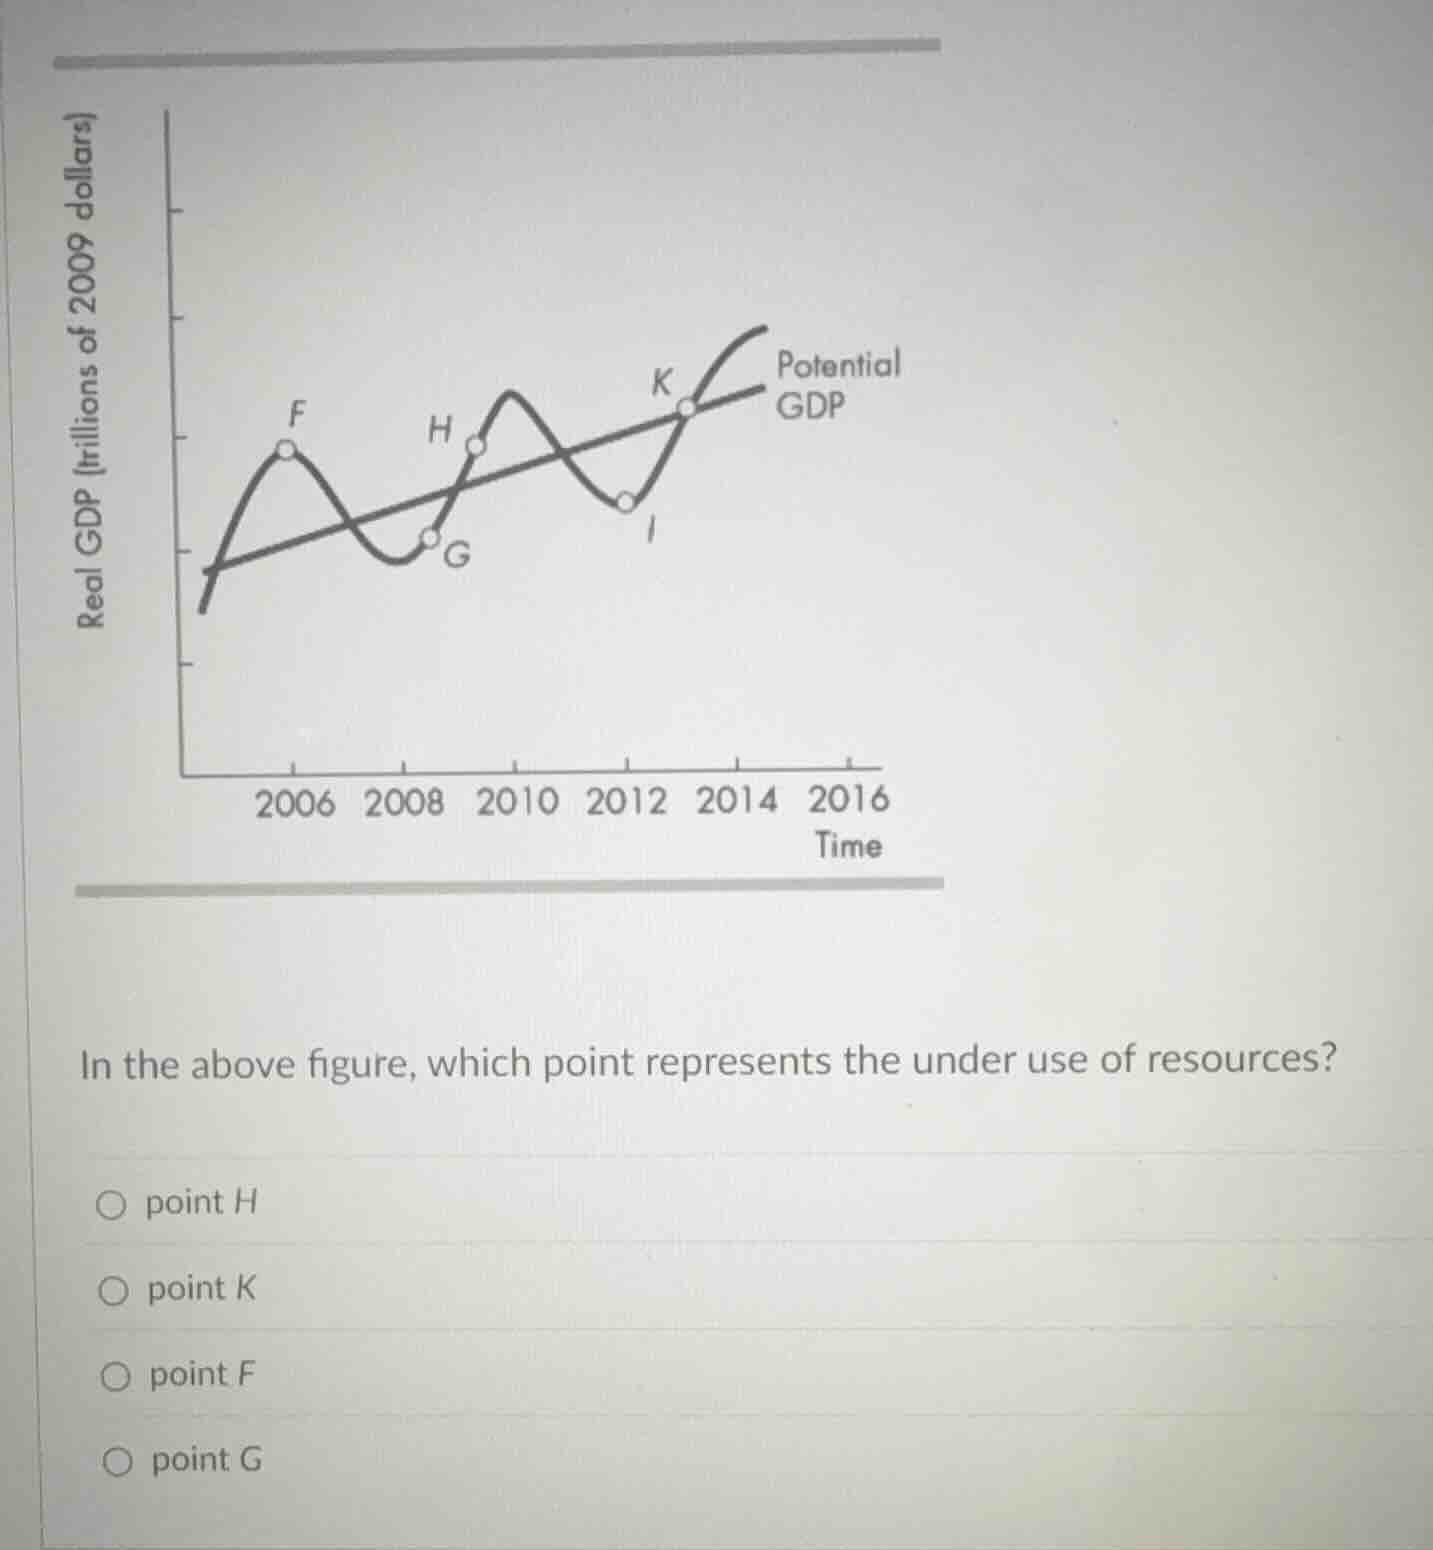
in the above figure, which point represents the under use of resources?
○ point h
○ point k
○ point f
○ point g
Potential GDP represents the maximum output an economy can produce with full resource utilization. When real GDP is below potential GDP, resources are underused. Point G is below the Potential GDP line, indicating underuse. Points H, K are on or above (K is on, H is above? Wait, no—wait, the real GDP curve: Potential GDP is the straight line. So real GDP at G is below Potential GDP, meaning the economy is producing less than its potential, so resources are underused. Point F is a peak (above? Wait, no, the first peak F: is F above or below Potential? Wait the initial crossing: the real GDP curve starts, crosses Potential, goes up to F (above?), then down to G (below), then up to H (above?), then a peak, then down to I (below?), then up to K (on Potential). So G is below Potential GDP, so underuse.

Snap & solve any problem in the app
Get step-by-step solutions on Sovi AI
Photo-based solutions with guided steps
Explore more problems and detailed explanations
point G