QUESTION IMAGE
Question
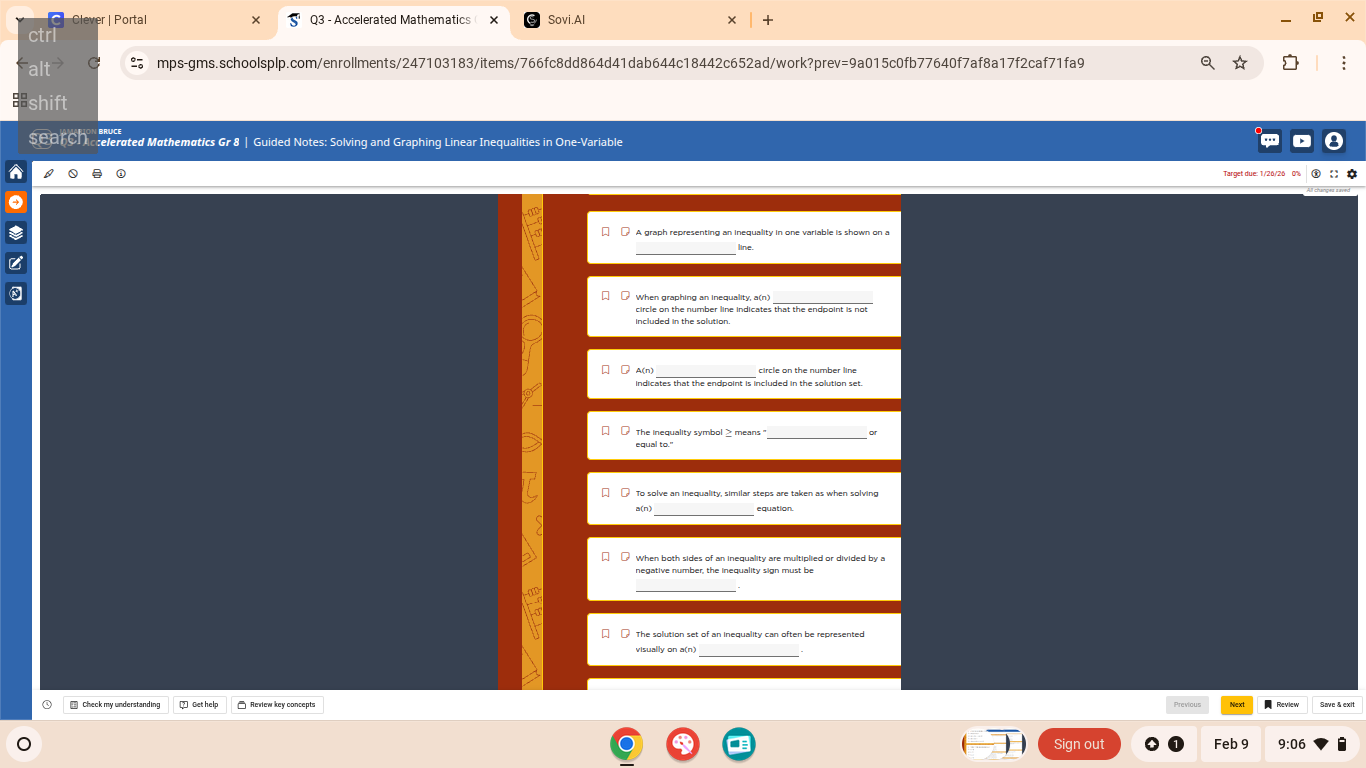
accelerated mathematics gr 8 | guided notes: solving and graphing linear inequalities in one-variable
target due: 1/26/26 0%
- a graph representing an inequality in one variable is shown on a ____________ line.
- when graphing an inequality, a(n) ____________ circle on the number line indicates that the endpoint is not included in the solution.
- a(n) ____________ circle on the number line indicates that the endpoint is included in the solution set.
- the inequality symbol $geq$ means \ ____________ or equal to.\
- to solve an inequality, similar steps are taken as when solving a(n) ____________ equation.
- when both sides of an inequality are multiplied or divided by a negative number, the inequality sign must be ____________.
- the solution set of an inequality can often be represented visually on a(n) ____________.
Step1: Fill 1-variable inequality graph line
A 1-variable inequality graph uses a number line.
Step2: Fill non-included endpoint circle
Open circles mean endpoints are excluded.
Step3: Fill included endpoint circle
Closed circles mean endpoints are included.
Step4: Translate $\geq$ symbol
$\geq$ reads as "greater than or equal to".
Step5: Relate inequality to equation solving
Inequalities use same steps as linear equations.
Step6: Rule for negative multiplication/division
Mult/div by negative reverses inequality sign.
Step7: Visual solution set representation
Solution sets are shown on a number line.

Snap & solve any problem in the app
Get step-by-step solutions on Sovi AI
Photo-based solutions with guided steps
Explore more problems and detailed explanations
- number
- open
- closed
- greater than
- linear
- reversed
- number line