QUESTION IMAGE
Question
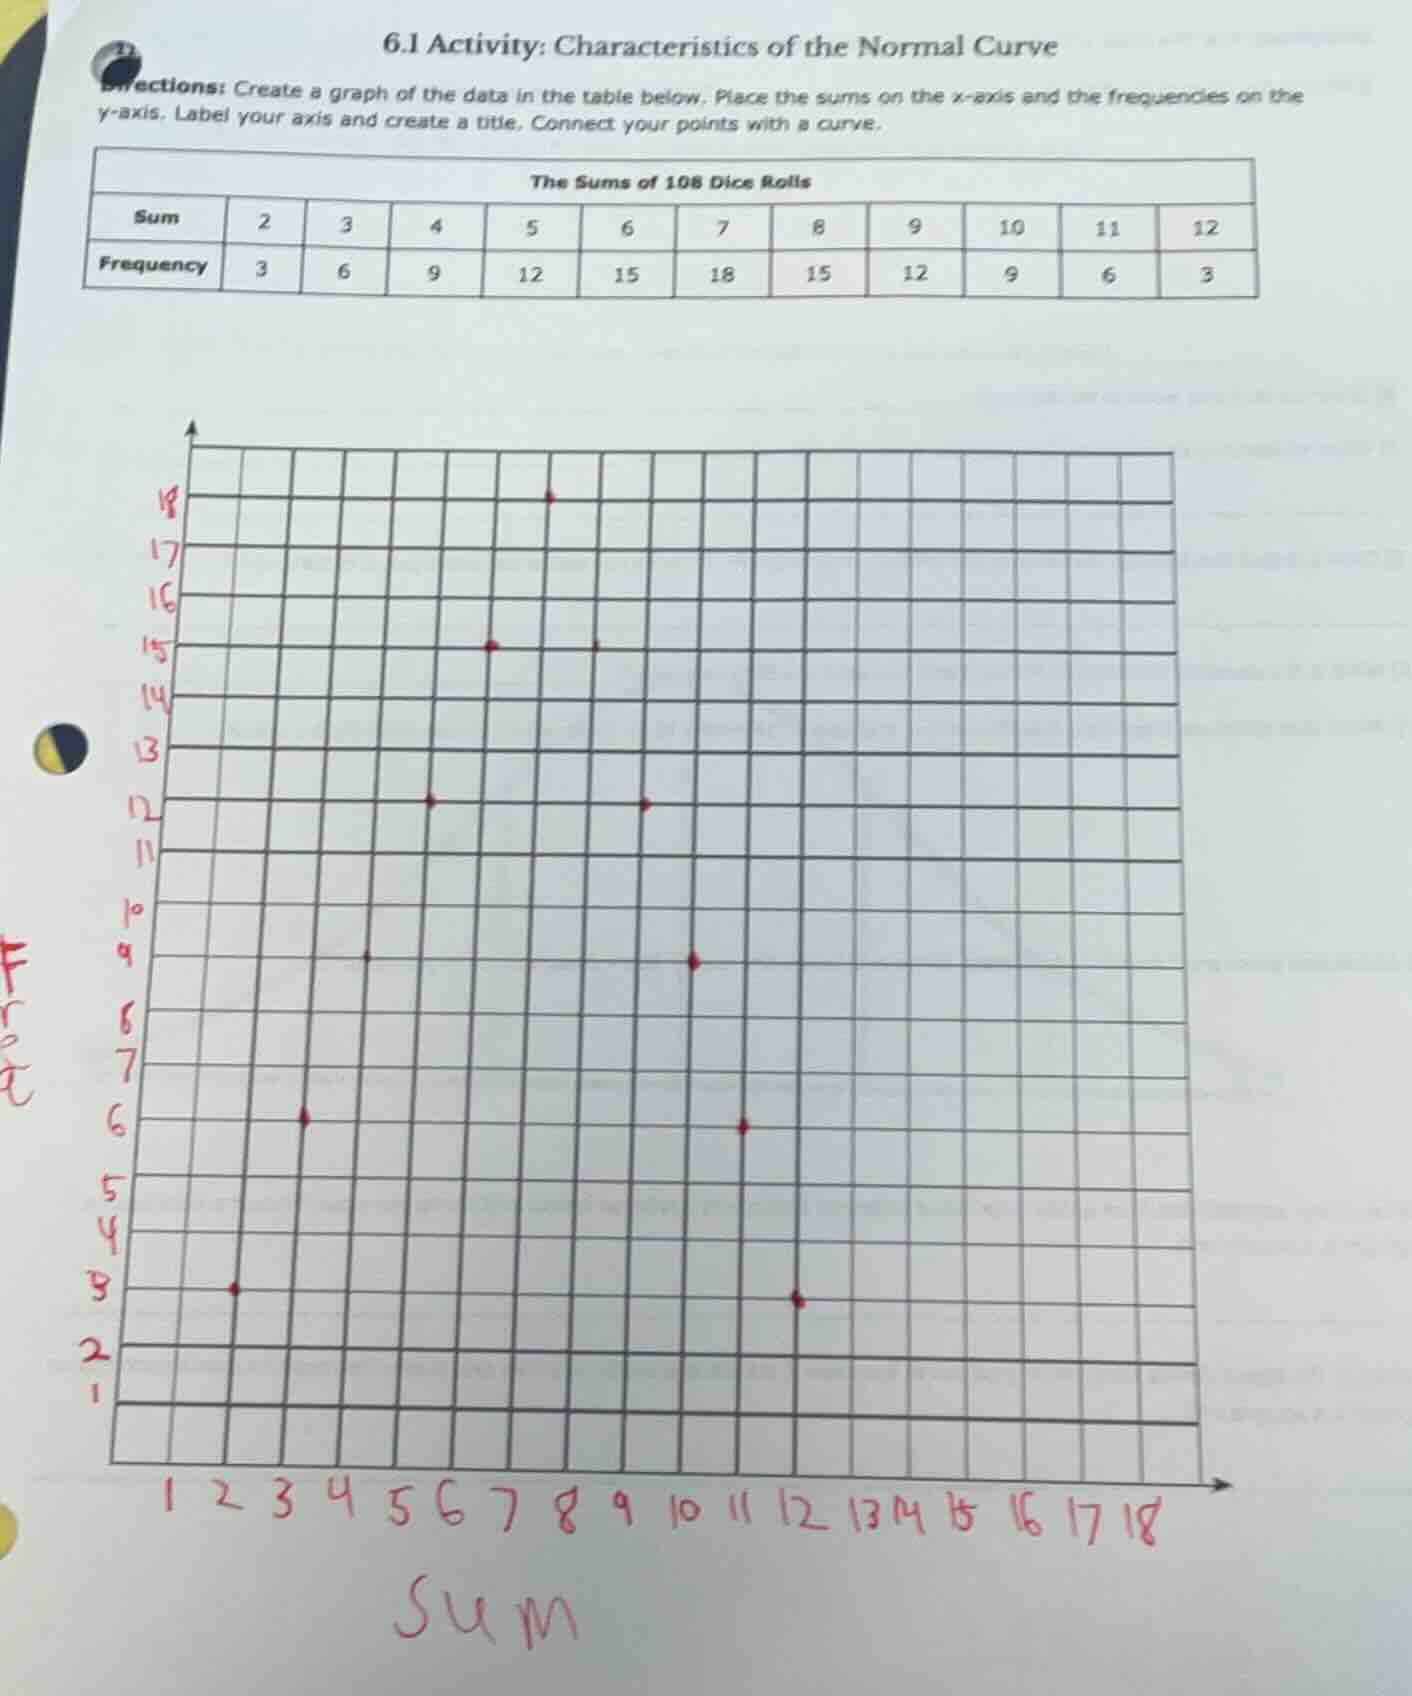
6.1 activity: characteristics of the normal curve
directions: create a graph of the data in the table below. place the sums on the x - axis and the frequencies on the y - axis. label your axis and create a title. connect your points with a curve.
the sums of 108 dice rolls
| sum | 2 | 3 | 4 | 5 | 6 | 7 | 8 | 9 | 10 | 11 | 12 |
| frequency | 3 | 6 | 9 | 12 | 15 | 18 | 15 | 12 | 9 | 6 | 3 |
Step1: Correct x-axis labeling
The x-axis should only include the sums from the table: 2, 3, 4, 5, 6, 7, 8, 9, 10, 11, 12 (remove extra values 1,13-18). Label it "Sum of Two Dice Rolls".
Step2: Correct y-axis labeling
Label the y-axis "Frequency" (matches the table's frequency values: 3,6,9,12,15,18).
Step3: Add graph title
Use the title "Frequency of Sums from 108 Dice Rolls".
Step4: Plot remaining points
Add the missing points:
- Sum=2, Frequency=3
- Sum=10, Frequency=9
- Sum=11, Frequency=6
- Sum=12, Frequency=3
Step5: Connect points with curve
Draw a smooth curve through all plotted points in order of increasing sum.

Snap & solve any problem in the app
Get step-by-step solutions on Sovi AI
Photo-based solutions with guided steps
Explore more problems and detailed explanations
- Axis Labels: X-axis = "Sum of Two Dice Rolls" (values 2-12), Y-axis = "Frequency" (values 0-18)
- Graph Title: "Frequency of Sums from 108 Dice Rolls"
- Plotted Points (x,y): (2,3), (3,6), (4,9), (5,12), (6,15), (7,18), (8,15), (9,12), (10,9), (11,6), (12,3)
- Final Graph: A smooth, symmetric bell-shaped curve connecting all the plotted points, matching the normal curve characteristic.