QUESTION IMAGE
Question
activity
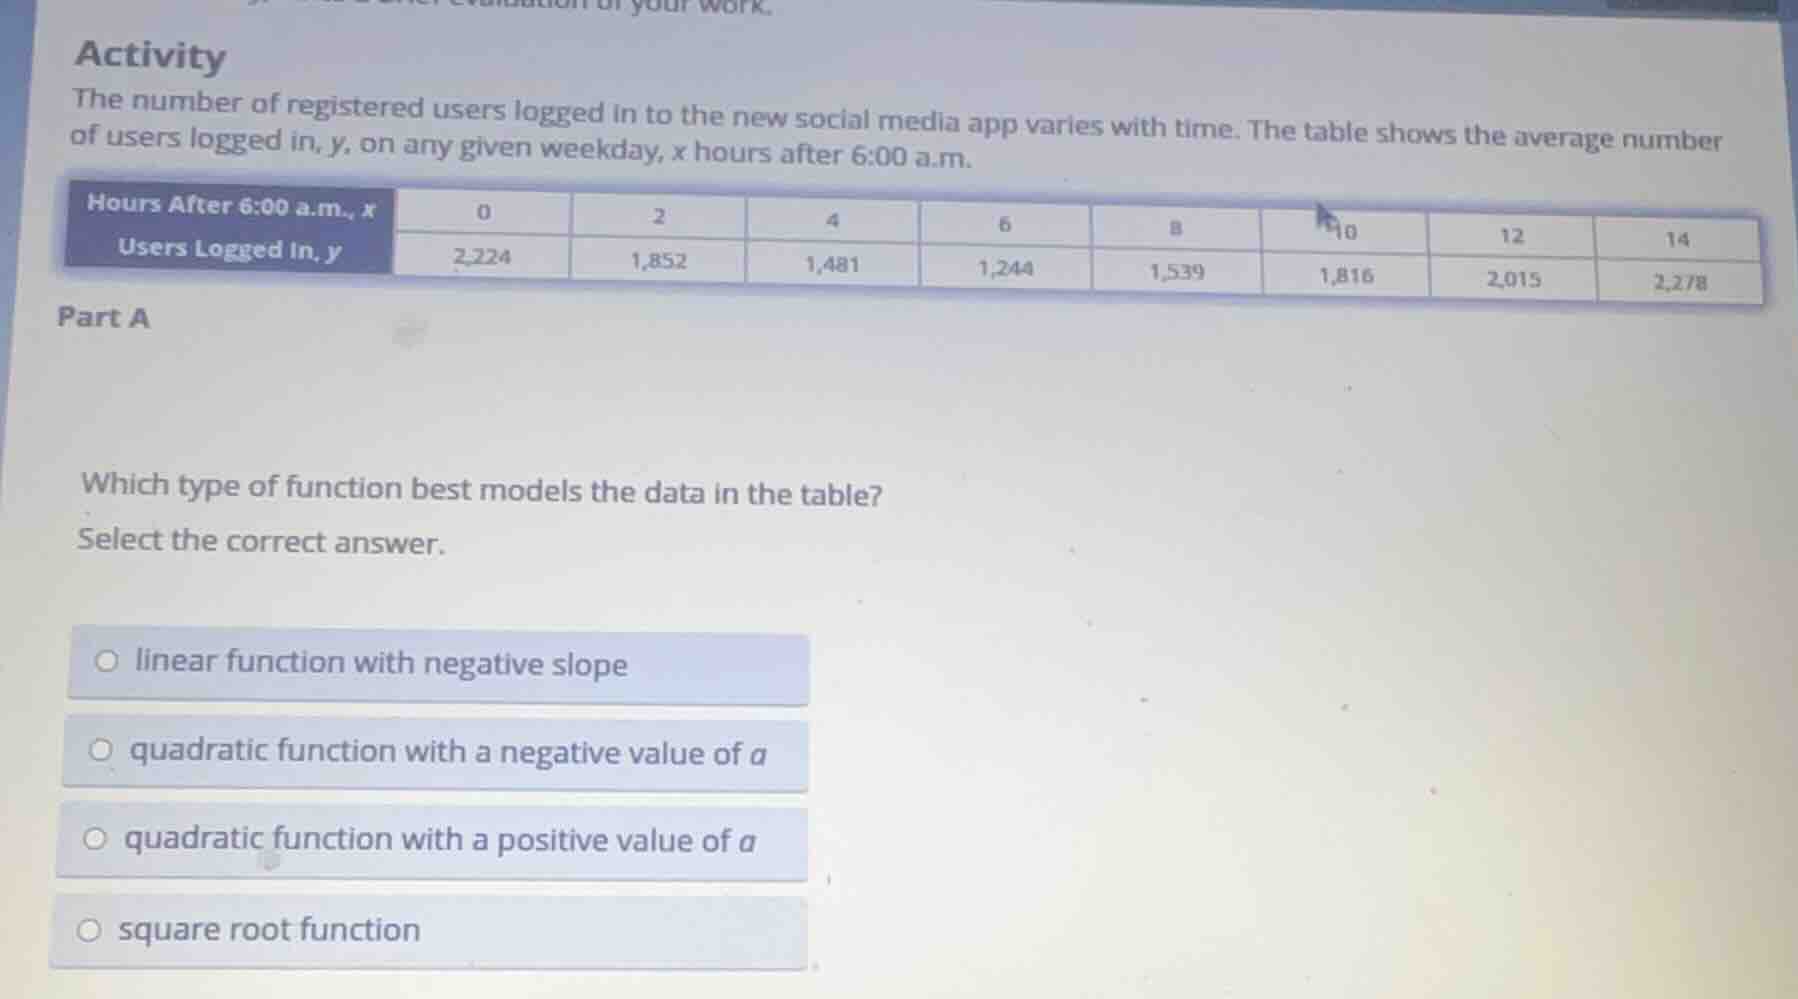
the number of registered users logged in to the new social media app varies with time. the table shows the average number of users logged in, y, on any given weekday, x hours after 6:00 a.m.
hours after 6:00 a.m., x | 0 | 2 | 4 | 6 | 8 | 10 | 12 | 14
users logged in, y | 2,224 | 1,852 | 1,481 | 1,244 | 1,539 | 1,816 | 2,015 | 2,278
part a
which type of function best models the data in the table?
select the correct answer.
- linear function with negative slope
- quadratic function with a negative value of a
- quadratic function with a positive value of a
- square root function
First, observe the data trend: the value of $y$ decreases from $x=0$ to $x=6$, then increases from $x=6$ to $x=14$, forming a U-shape. A linear function would show a consistent increasing or decreasing trend, so it is not a match. A square root function only increases, so it is not a match. A quadratic function has the form $y=ax^2+bx+c$; when $a>0$, it opens upward (U-shape), which matches the data's trend of decreasing then increasing. When $a<0$, it opens downward (inverted U-shape), which does not fit.

Snap & solve any problem in the app
Get step-by-step solutions on Sovi AI
Photo-based solutions with guided steps
Explore more problems and detailed explanations
quadratic function with a positive value of $a$