QUESTION IMAGE
Question
additional practice
for exercises 1-4, use the graphs to answer the questions.
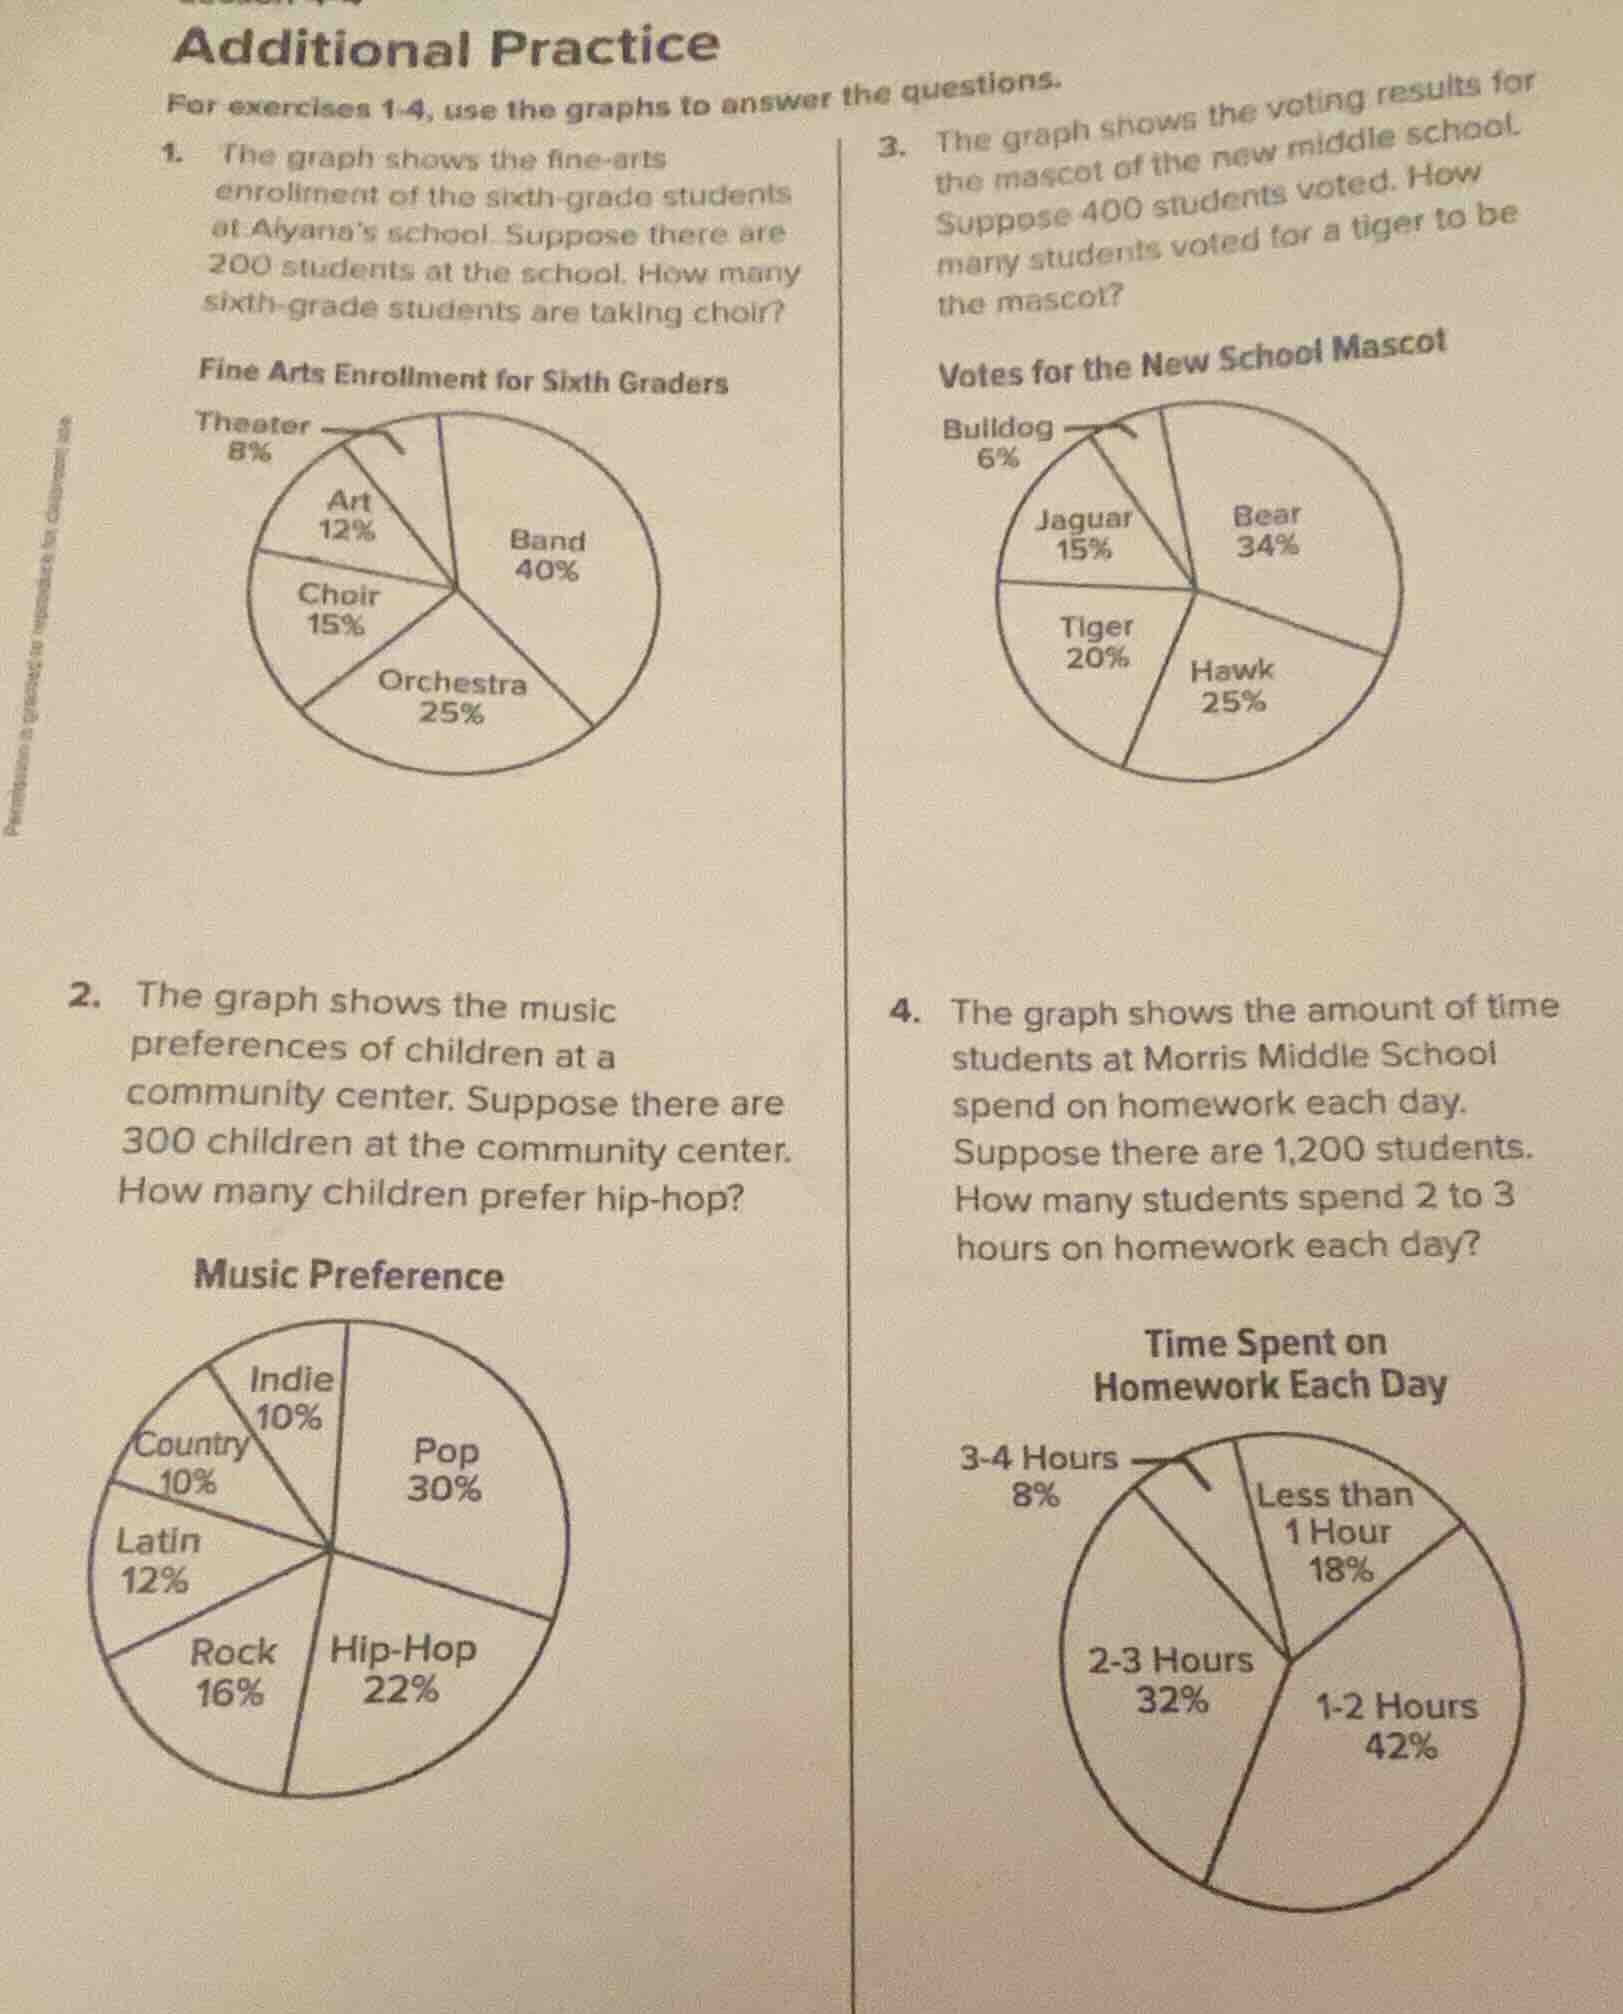
- the graph shows the fine - arts enrollment of the sixth - grade students at alyana’s school. suppose there are 200 students at the school. how many sixth - grade students are taking choir?
fine arts enrollment for sixth graders
(the pie chart: theater 8%, art 12%, choir 15%, orchestra 25%, band 40%)
- the graph shows the music preferences of children at a community center. suppose there are 300 children at the community center. how many children prefer hip - hop?
music preference
(the pie chart: indie 10%, pop 30%, hip - hop 22%, rock 16%, latin 12%, country 10%)
- the graph shows the voting results for the mascot of the new middle school. suppose 400 students voted. how many students voted for a tiger to be the mascot?
votes for the new school mascot
(the pie chart: bulldog 6%, jaguar 15%, tiger 20%, hawk 25%, bear 34%)
- the graph shows the amount of time students at morris middle school spend on homework each day. suppose there are 1,200 students. how many students spend 2 to 3 hours on homework each day?
time spent on homework each day
(the pie chart: less than 1 hour 18%, 1 - 2 hours 42%, 2 - 3 hours 32%, 3 - 4 hours 8%)
Step1: Calculate choir students
Multiply total students by choir percentage.
$200 \times 15\% = 200 \times 0.15 = 30$
Step2: Calculate hip-hop fans
Multiply total children by hip-hop percentage.
$300 \times 22\% = 300 \times 0.22 = 66$
Step3: Calculate tiger voters
Multiply total voters by tiger percentage.
$400 \times 20\% = 400 \times 0.20 = 80$
Step4: Calculate 2-3 hour homework students
Multiply total students by 2-3 hour percentage.
$1200 \times 32\% = 1200 \times 0.32 = 384$

Snap & solve any problem in the app
Get step-by-step solutions on Sovi AI
Photo-based solutions with guided steps
Explore more problems and detailed explanations
- 30
- 66
- 80
- 384