QUESTION IMAGE
Question
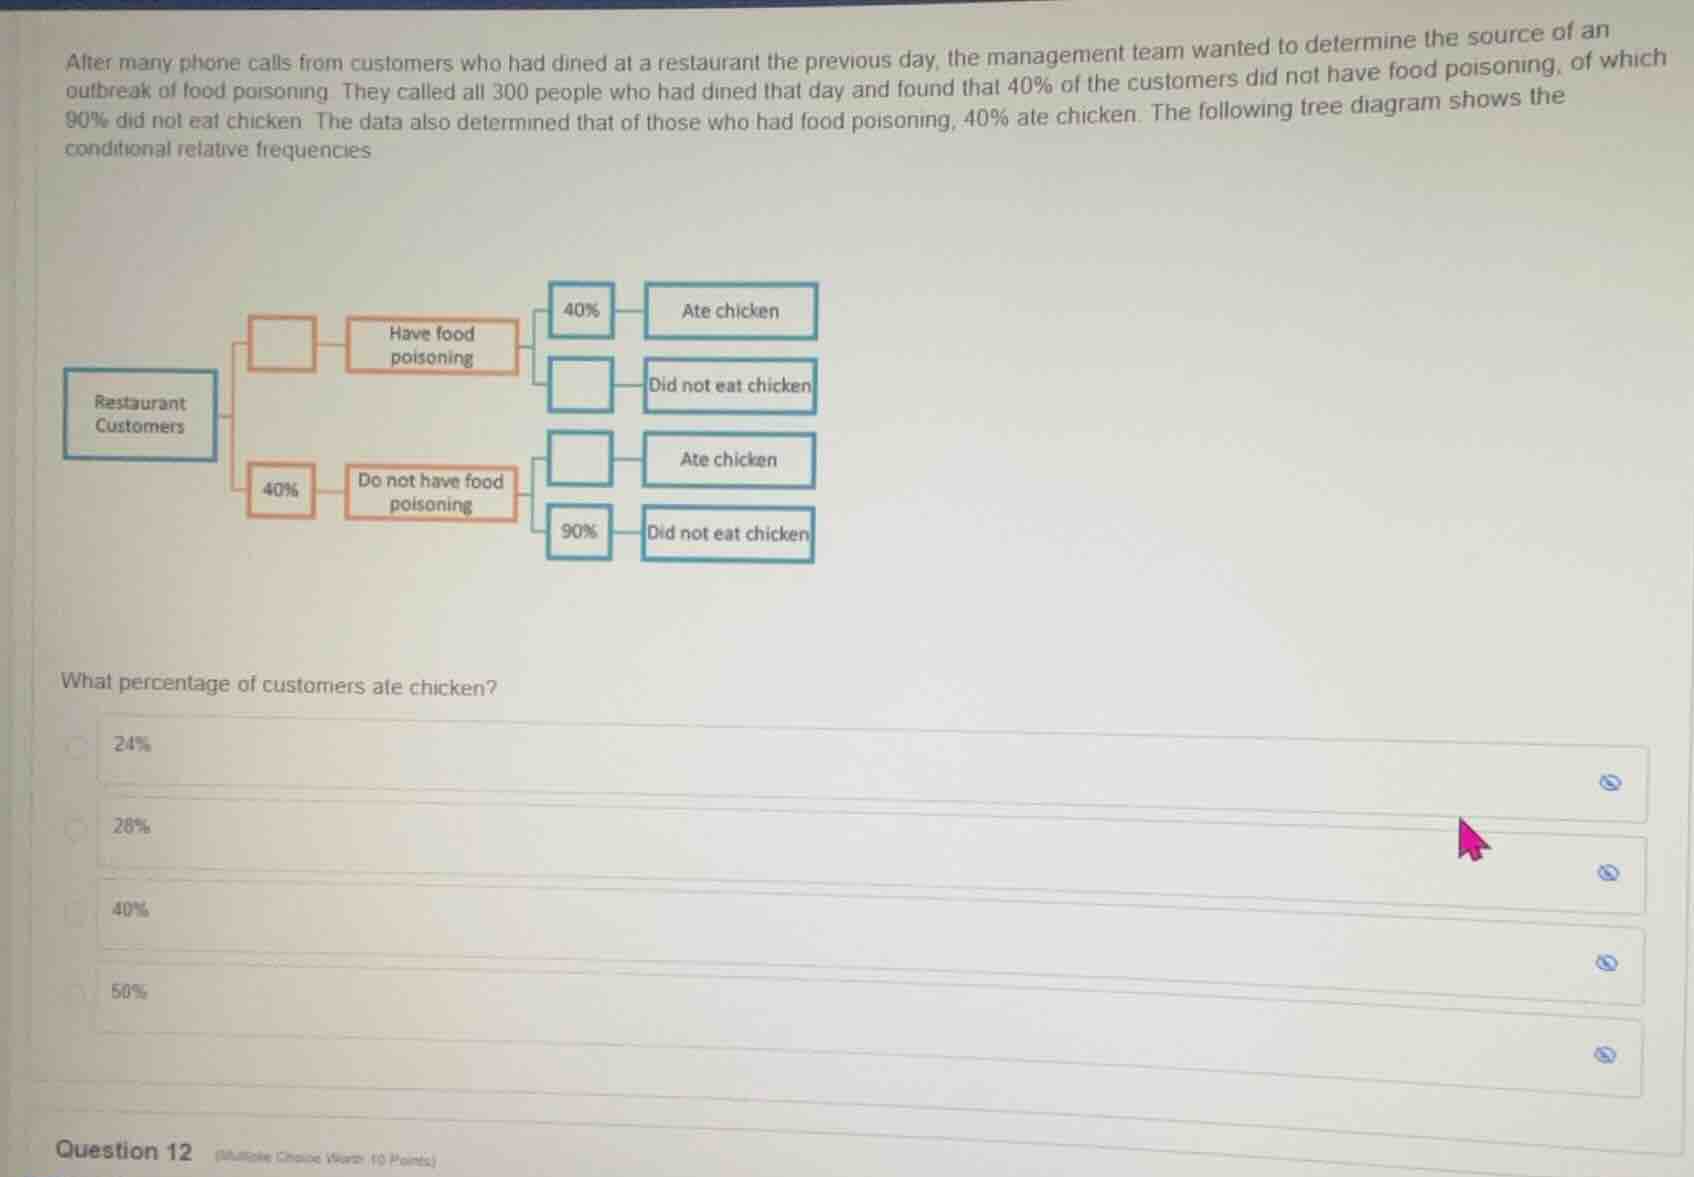
after many phone calls from customers who had dined at a restaurant the previous day, the management team wanted to determine the source of an outbreak of food poisoning. they called all 300 people who had dined that day and found that 40% of the customers did not have food poisoning, of which 90% did not eat chicken. the data also determined that of those who had food poisoning, 40% ate chicken. the following tree diagram shows the conditional relative frequencies
what percentage of customers ate chicken?
24%
26%
40%
50%
question 12 (multiple choice worth 10 points)
Step1: Find % with food poisoning
Since 40% did not have food poisoning, the percentage with food poisoning is:
$100\% - 40\% = 60\%$
Step2: Find % with poisoning who ate chicken
40% of those with poisoning ate chicken. Calculate this portion:
$60\% \times 40\% = 0.6 \times 0.4 = 24\%$
Step3: Find % without poisoning who ate chicken
90% of those without poisoning did not eat chicken, so 10% ate chicken. Calculate this portion:
$40\% \times (100\% - 90\%) = 0.4 \times 0.1 = 4\%$
Step4: Sum the two chicken-eating groups
Add the two percentages to get total chicken eaters:
$24\% + 4\% = 28\%$

Snap & solve any problem in the app
Get step-by-step solutions on Sovi AI
Photo-based solutions with guided steps
Explore more problems and detailed explanations
28%