QUESTION IMAGE
Question
after six years of successional time, about how much organic mass is produced per square meter per year?
passage i
ecological succession is the way species change composition in an area over time. for example, a grassland may eventually become populated by trees.
ecologists have conducted a study of brazilian rainforests that have been subjected to slash - and - burn agriculture. the brazilian natives burn the rainforest and use the resulting highly fertilized land for farming. after many years, wildlife and vegetation begin to return to the area.
table 1 shows the various bird species, dominant (most prevalent) plants, as well as the successional time in years of various plots of rainforest subjected to slash - and - burn agriculture.
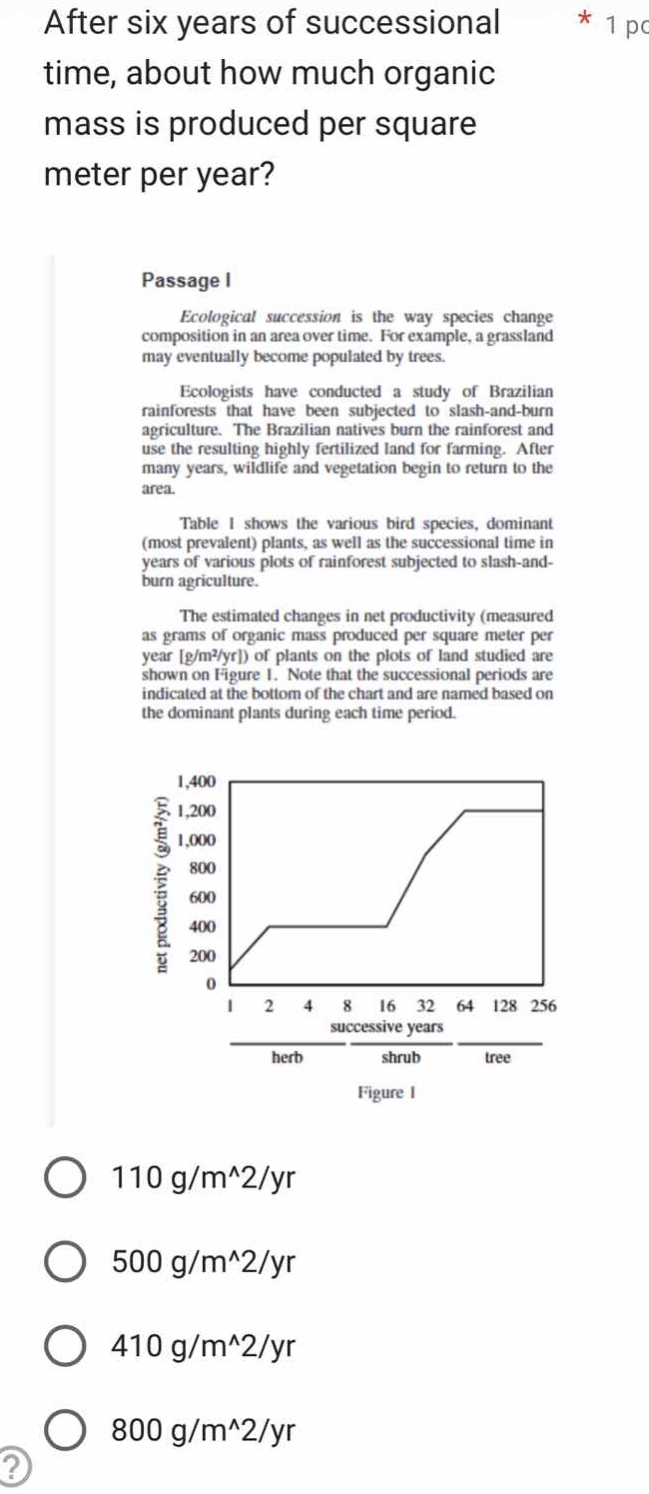
the estimated changes in net productivity (measured as grams of organic mass produced per square meter per year g/m²/yr) of plants on the plots of land studied are shown on figure 1. note that the successional periods are indicated at the bottom of the chart and are named based on the dominant plants during each time period.
figure 1: a graph with net productivity (g/m²/yr) on the y - axis (ranging from 0 to 1400) and successive years on the x - axis (1, 2, 4, 8, 16, 32, 64, 128, 256) with three periods: herb (1 - 8 years), shrub (16 - 32 years), tree (64 - 256 years). the graph shows an increase in net productivity over time.
options:
- 110 g/m²/yr
- 500 g/m²/yr
- 410 g/m²/yr
- 800 g/m²/yr
Step1: Locate 6 years on x-axis
Find the position of 6 on the successive years (x-axis) of Figure 1, which falls between 4 and 8 years, in the herb stage.
Step2: Match to net productivity
The net productivity line is flat at ~400 g/m²/yr between 2 and 16 years. 6 years falls in this interval, so the value is closest to 410 g/m²/yr.

Snap & solve any problem in the app
Get step-by-step solutions on Sovi AI
Photo-based solutions with guided steps
Explore more problems and detailed explanations
410 g/m^2/yr