QUESTION IMAGE
Question
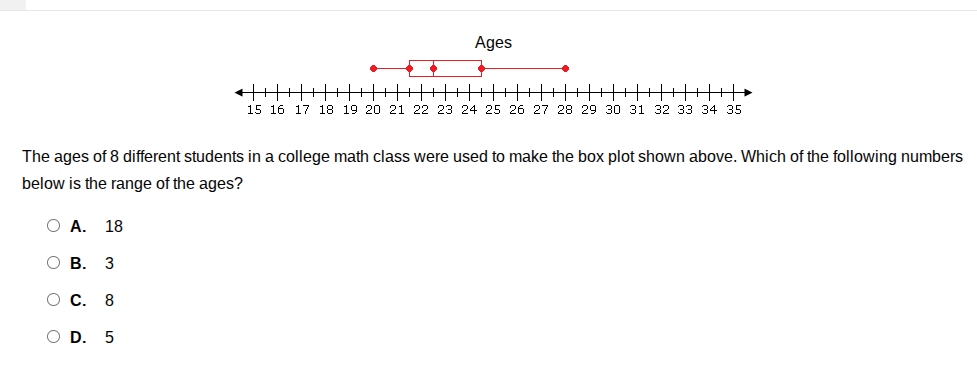
ages
15 16 17 18 19 20 21 22 23 24 25 26 27 28 29 30 31 32 33 34 35
the ages of 8 different students in a college math class were used to make the box plot shown above. which of the following numbers below is the range of the ages?
a. 18
b. 3
c. 8
d. 5
Step1: Recall the formula for range
The range of a data set is calculated as the difference between the maximum value and the minimum value, i.e., \( \text{Range} = \text{Maximum} - \text{Minimum} \).
Step2: Identify maximum and minimum from the box plot
From the box plot, the minimum age (leftmost dot) is at 20, and the maximum age (rightmost dot) is at 28.
Step3: Calculate the range
Using the formula, \( \text{Range} = 28 - 20 = 8 \).

Snap & solve any problem in the app
Get step-by-step solutions on Sovi AI
Photo-based solutions with guided steps
Explore more problems and detailed explanations
C. 8